

Question: Hi There, I am looking for question 2, I will be grateful if you help on that. For part (a) I want the right model
Hi There, I am looking for question 2, I will be grateful if you help on that. For part (a) I want the right model for it. I am working on sas to derive ANOVA for parts (b) and (c). I was wondering if I can check my solution with you for parts (b) and (c)
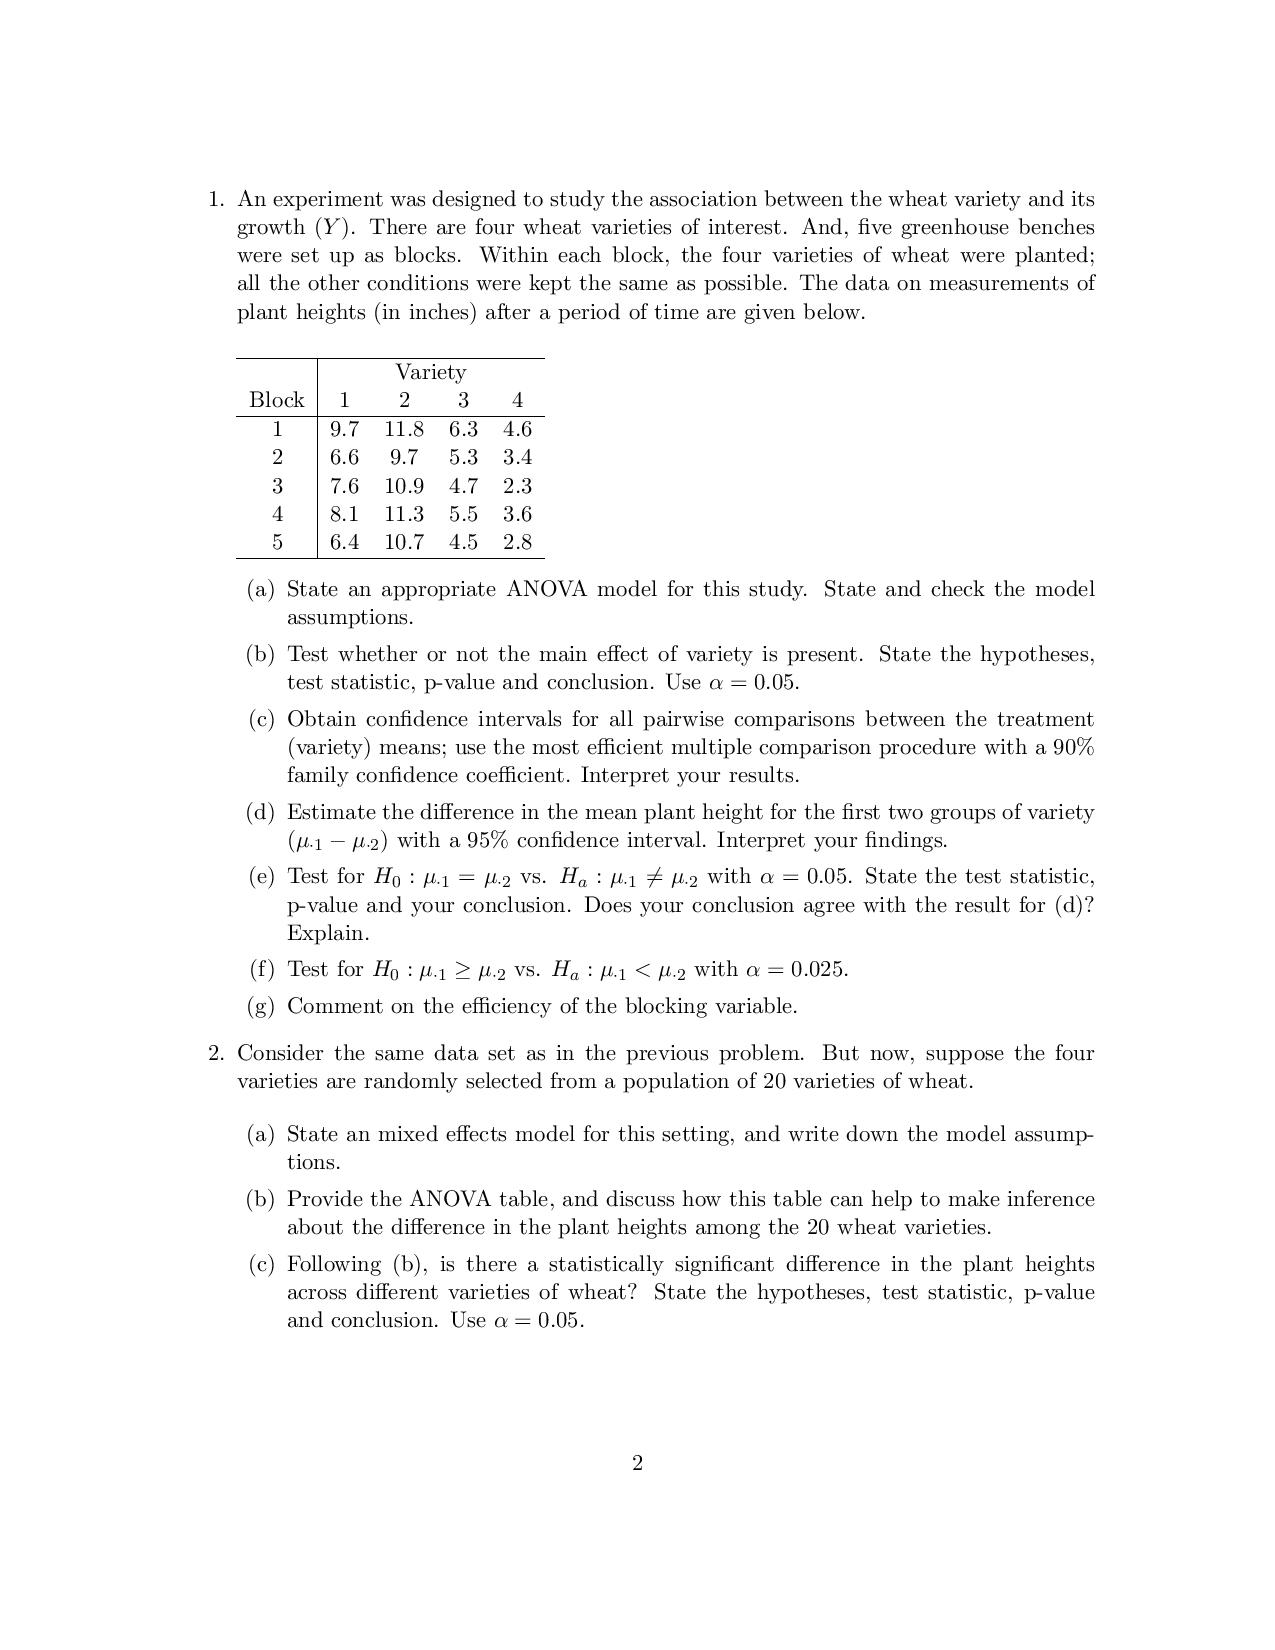
1. An experiment was designed to study the association between the wheat variety and its growth (Y). There are four wheat varieties of interest. And, ve greenhouse benches were set up as blocks. Within each block. the four varieties of wheat were planted; all the other conditions were kept the same as possible. The data on measurements of plant heights (in inches) after a period of time are given below. Variety Block 1 2 3 4 1 9.7 11.8 6.3 4.5 5.6 9.7 5.3 3.4 7.0 10.9 4.7 2.3 8.1 11.3 5.5 3.5 6.4 10.7 4.5 2.8 Ulrika-7b.: (a) State an appropriate ANOVA model for this study. State and check the model assumptions. (b) Test whether or not the main effect of variety is present. State the hypotheses, test statistic1 pvalue and conclusion. Use a = 0.05. (c) Obtain condence intervals for all pairwise comparisons between the treatment (variety) means; use the most efcient multiple comparison procedure with a 90% family condence coefcient. Interpret your results. (d) Estimate the difference in the mean plant height for the rst two groups of variety (#1 1 {4.2) with a 95% condence interval. Interpret your ndings. (e) Test for H9 : it} = a; vs. Ha : 15.1 715 lug with or = 0.05. State the test statistic, pvalue and your conclusion. Does your conclusion agree with the result for (d)? Explain. (f) Test for Hg no.1 2 1.5.2 vs. Ha '. {1.1 (11.2 with or = 0.025. (g) Comment on the efciency of the blocking variable. 2. Consider the same data set as in the previous problem. But now, suppose the four varieties are randomly selected from a population of 20 varieties of wheat. (a) State an mixed effects model for this setting, and write down the model assump- tions. (b) Provide the ANOVA table, and discuss how this table can help to make inference about the difference in the plant heights among the 20 wheat varieties. (c) Following (b). is there a statistically signicant difference in the plant heights across different varieties of wheat? State the hypotheses, test statistic, pvalue and conclusion. Use or = 0.05
Step by Step Solution
There are 3 Steps involved in it

Get step-by-step solutions from verified subject matter experts