

Question: Hi there. I please need step by help help in understanding and answering the below questions. Not only the answers please. Thank you. Question 4
Hi there.
I please need step by help help in understanding and answering the below questions. Not only the answers please.
Thank you.

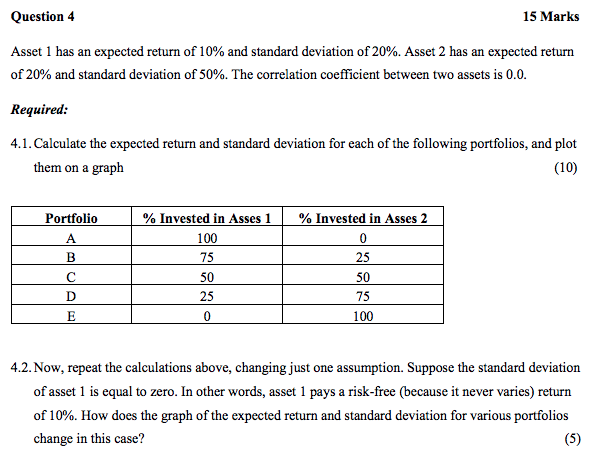
Question 4 15 Marks Asset 1 has an expected return of 10% and standard deviation of 20%. Asset 2 has an expected return of 20% and standard deviation of 50%. The correlation coefficient between two assets is 0.0. Required: 4.1. Calculate the expected return and standard deviation for each of the following portfolios, and plot them on a graph (10) Portfolio % Invested in Asses 1 % Invested in Asses 2 A 100 0 B 75 25 C 50 50 D 25 75 E 0 100 4.2. Now, repeat the calculations above, changing just one assumption. Suppose the standard deviation of asset 1 is equal to zero. In other words, asset 1 pays a risk-free (because it never varies) return of 10%. How does the graph of the expected return and standard deviation for various portfolios change in this case
Step by Step Solution
There are 3 Steps involved in it

Get step-by-step solutions from verified subject matter experts