

Question: Hi there! I really need some help with these questions.. Could you please help? QUESTION 4 [24] The quarterly sales (ya), where t denotes time.
Hi there! I really need some help with these questions.. Could you please help?
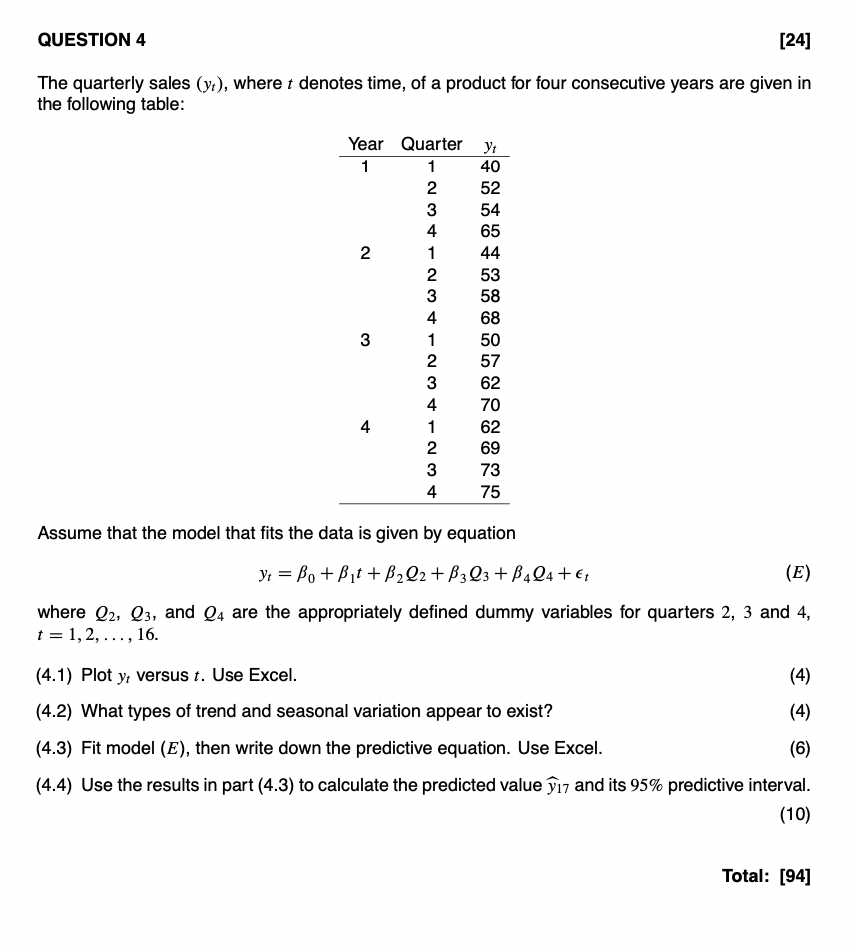
QUESTION 4 [24] The quarterly sales (ya), where t denotes time. of a product for four consecutive years are given in the following table: Year Quarter y, 1 4O 52 54 65 44 53 58 68 50 57 62 70 62 69 73 75 in) hWNHhWN-'hWN-'Jhwmd Assume that the model that ts the data is given by equation y!=0+lt+2Q2+3Q3+4Q4+Et (E) where 92, Qg, and Q4 are the appropriately defined dummy variables for quarters 2. 3 and 4, r: l,2,...,16. (4.1) Plot y; versus :. Use Excel. (4) (4.2) What types of trend and seasonal variation appear to exist? (4) (4.3) Fit model (E), then write down the predictive equation. Use Excel. (6) (4.4) Use the results in pan (4.3) to calculate the predicted value 3?\" and its 95% predictive interval. (10) Total: [94]
Step by Step Solution
There are 3 Steps involved in it

Get step-by-step solutions from verified subject matter experts