

Question: Hi there, please explain the trends between the two graphs and the reasons on why it has caused the two trends, please kindly explain the

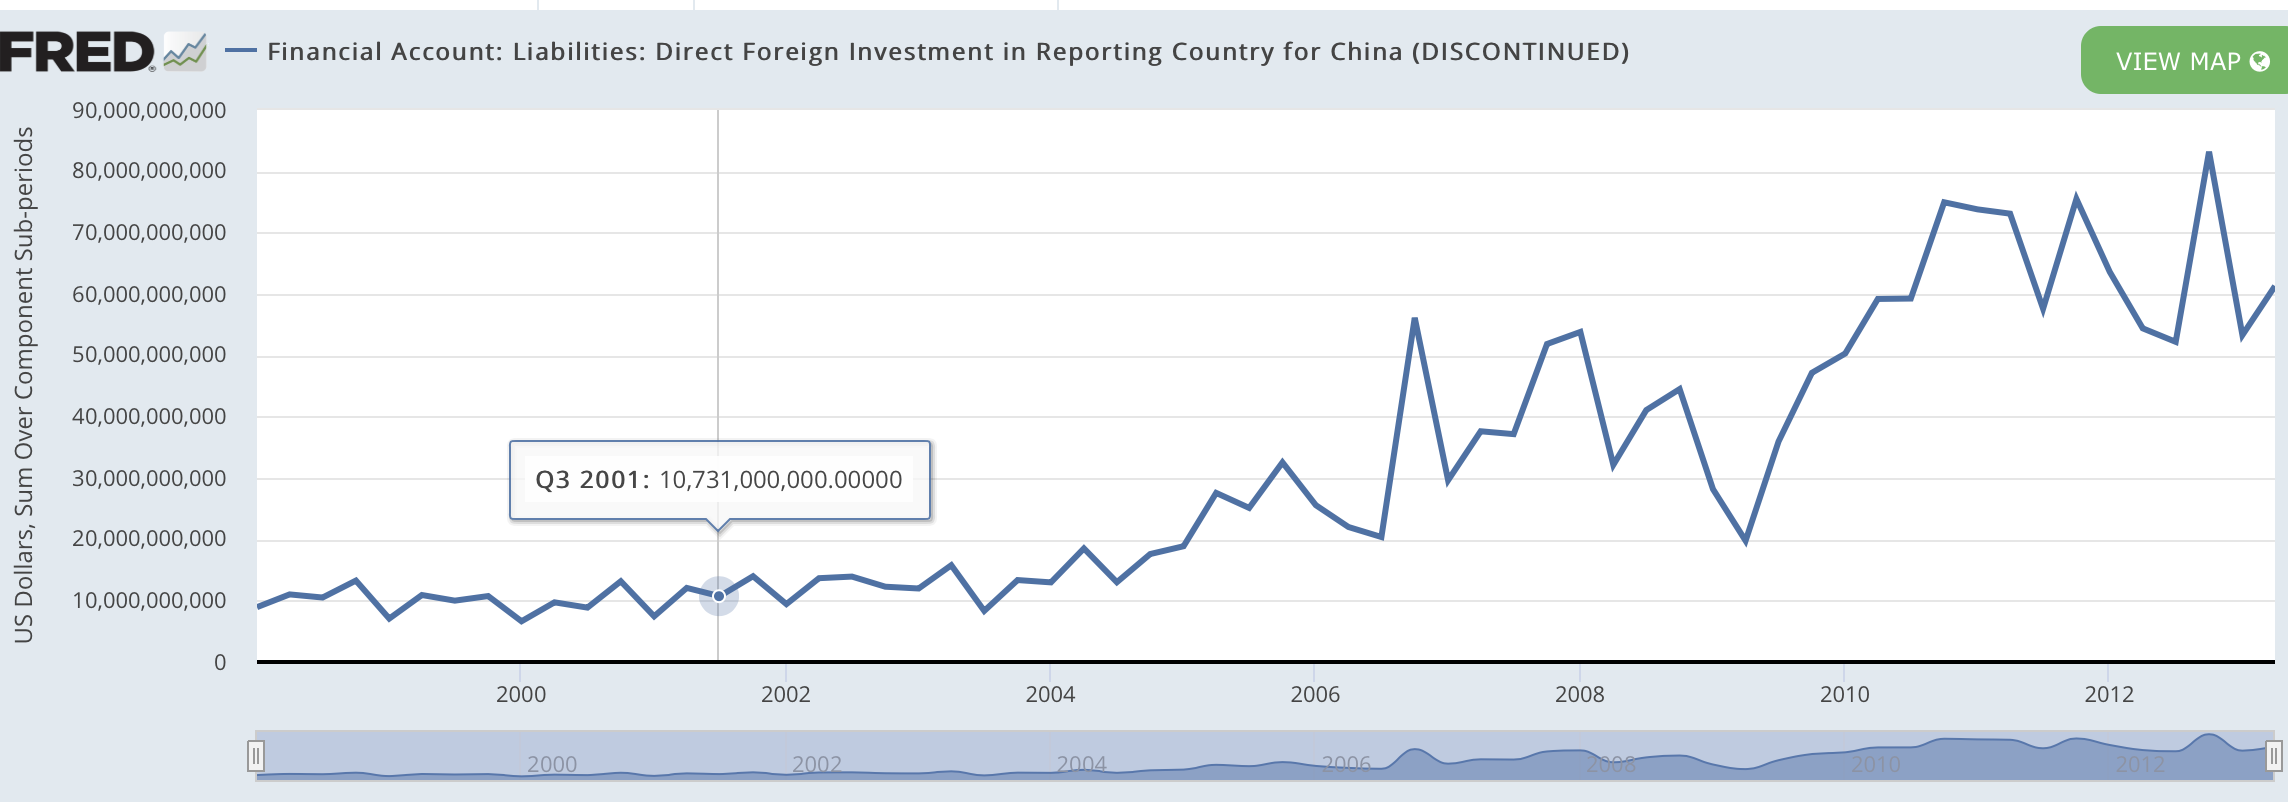
Hi there, please explain the trends between the two graphs and the reasons on why it has caused the two trends, please kindly explain the features as well(eg the rising trends, what caused it, a sudden downfall, what cause it etc., thanks !
PLEASE TRY AND IF ITS GOOD, I WILL RATE
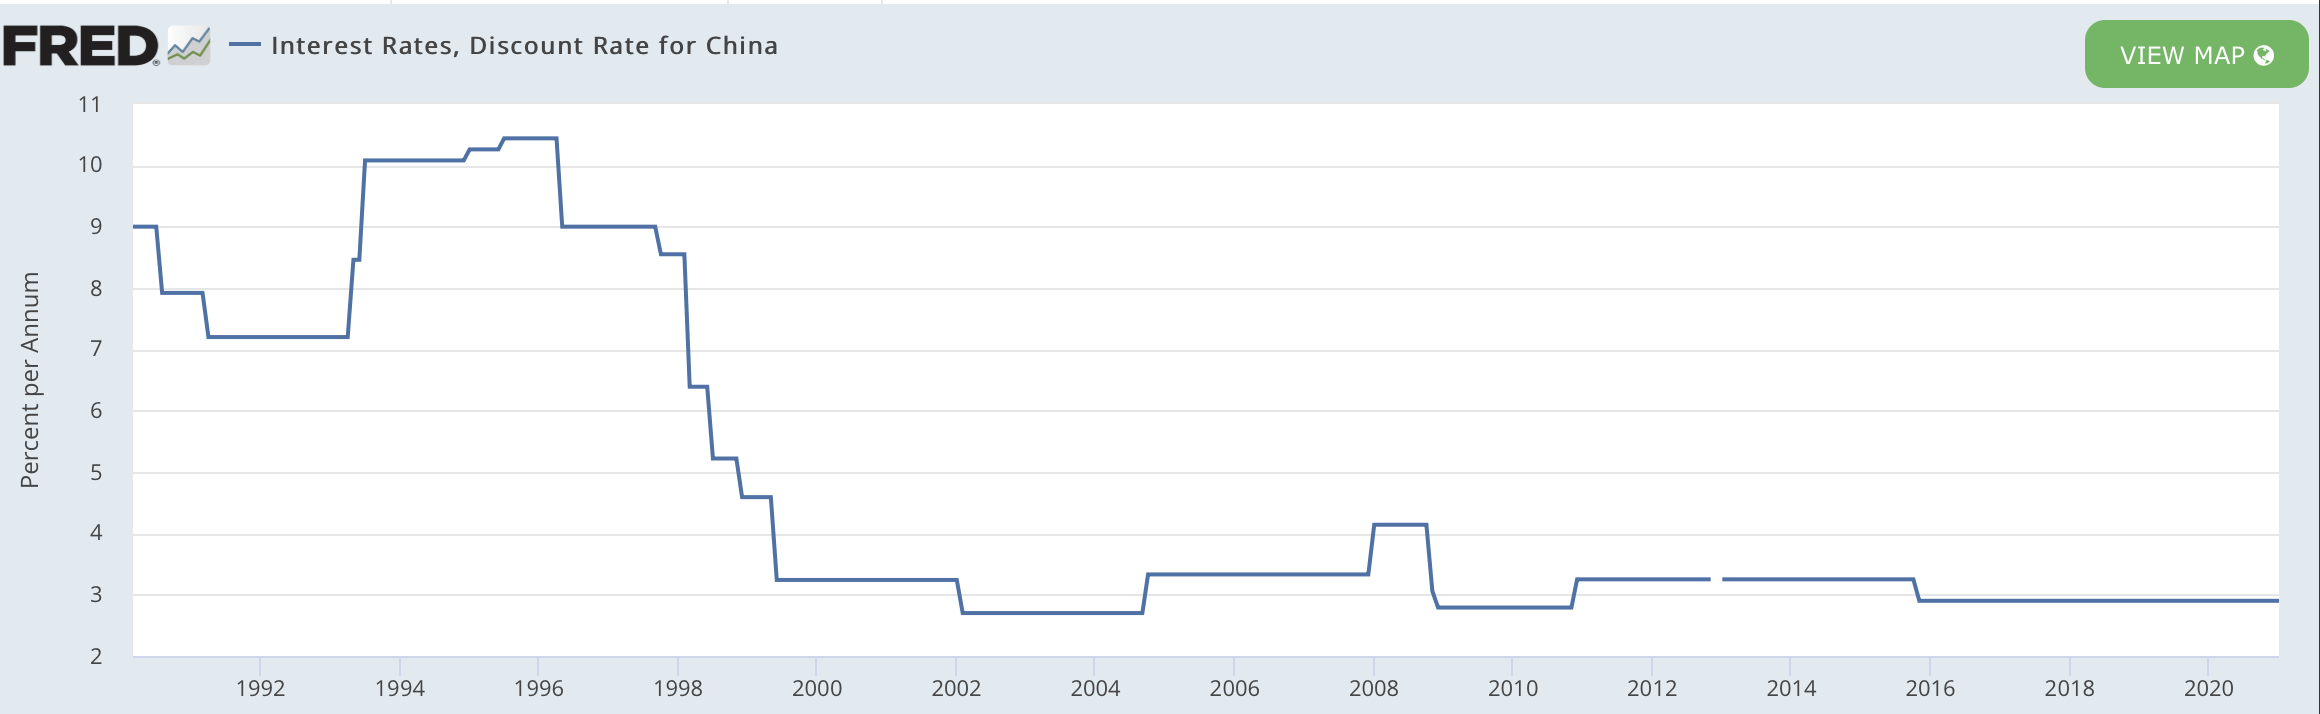

FRED ~ - Interest Rates, Discount Rate for China VIEW MAP 11 10 9 Percent per Annum A W 2 1992 1994 1996 1998 2000 2002 2004 2006 2008 2010 2012 2014 2016 2018 2020FRED' Financial Account: Liabilities: Direct Foreign Investment in Reporting Country for China (DISCONTINUED) US Dollars, Sum Over Component Sub-periods 90,000,000,000 80,000,000,000 70.000.000.000 60.000.000.000 50,000,000,000 40,000,000,000 30,000,000,000 20.000.000.000 10,000,000,000 0 Q3 2001: 10,731,000,000.00000
Step by Step Solution
There are 3 Steps involved in it

Get step-by-step solutions from verified subject matter experts