

Question: Hi there, Please take a look at the provided data snapshots and explain the following questions. 1) Why is this data appropriate to solve this
Hi there,
- Please take a look at the provided data snapshots and explain the following questions. 1) Why is this data appropriate to solve this problem? 2) Does your data have limitations? 3) Is there any kind of data that you would like to have but to which you do not have access? 4) What is an An appropriate predictive model.
Thank you
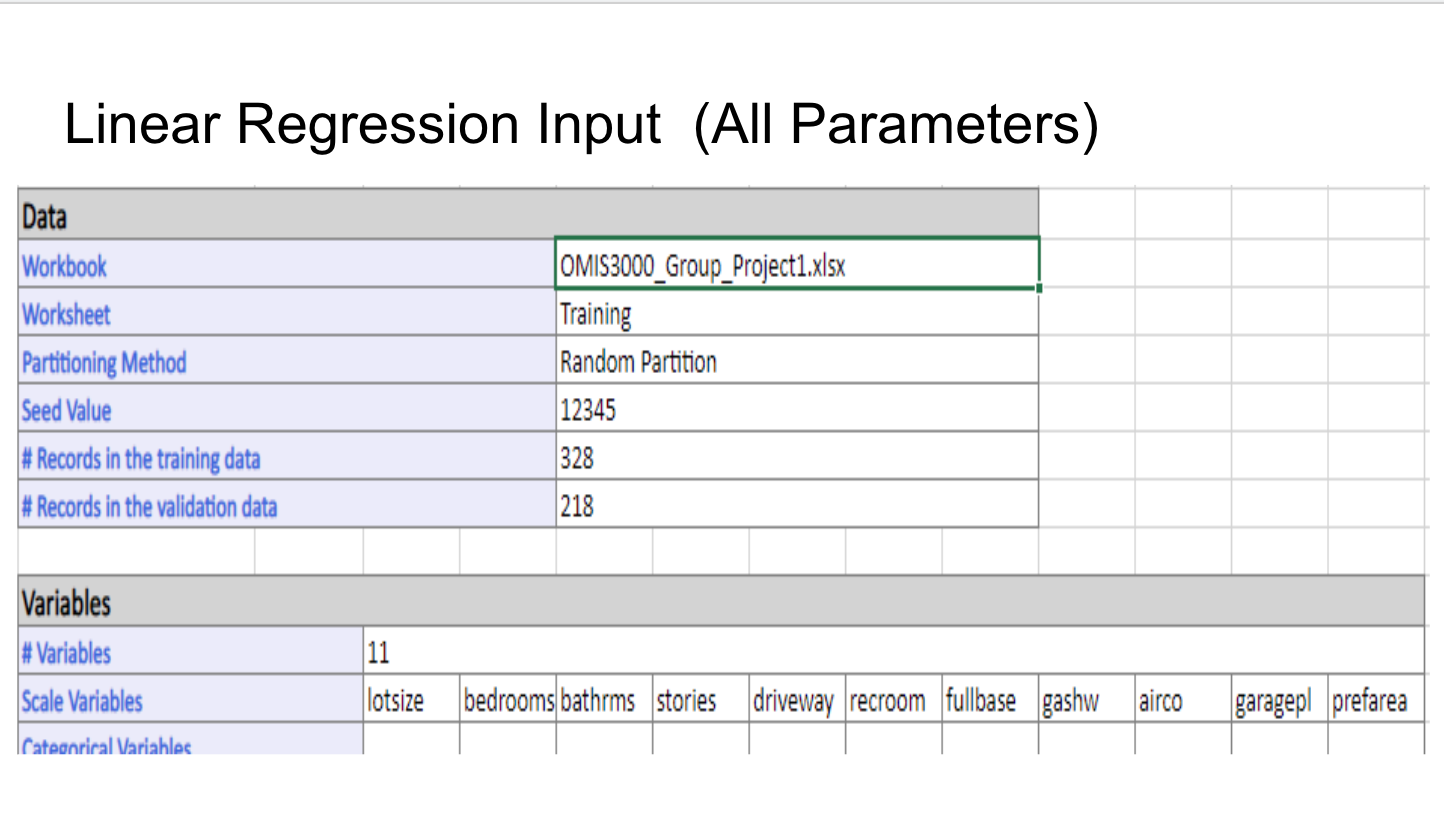
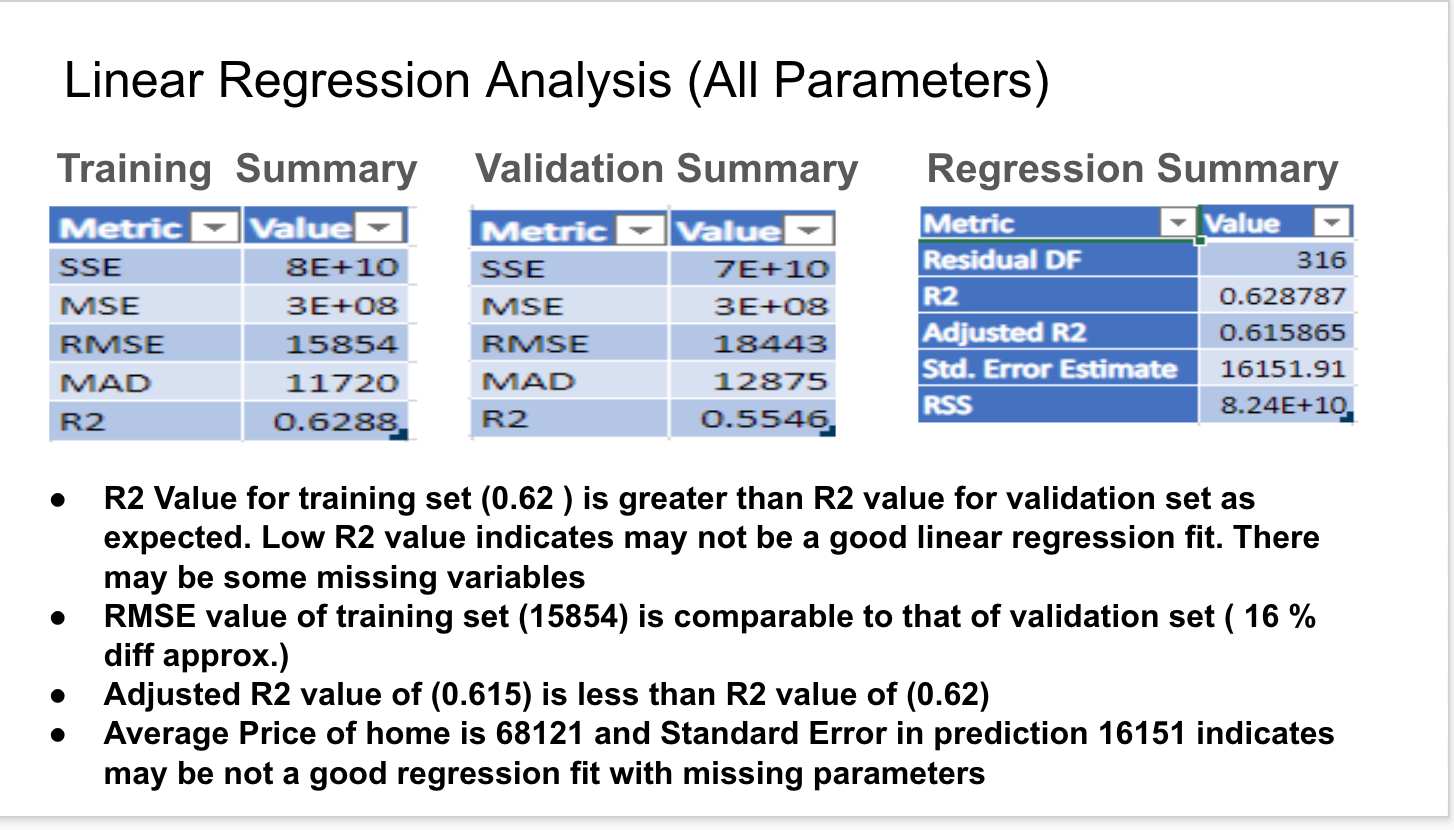
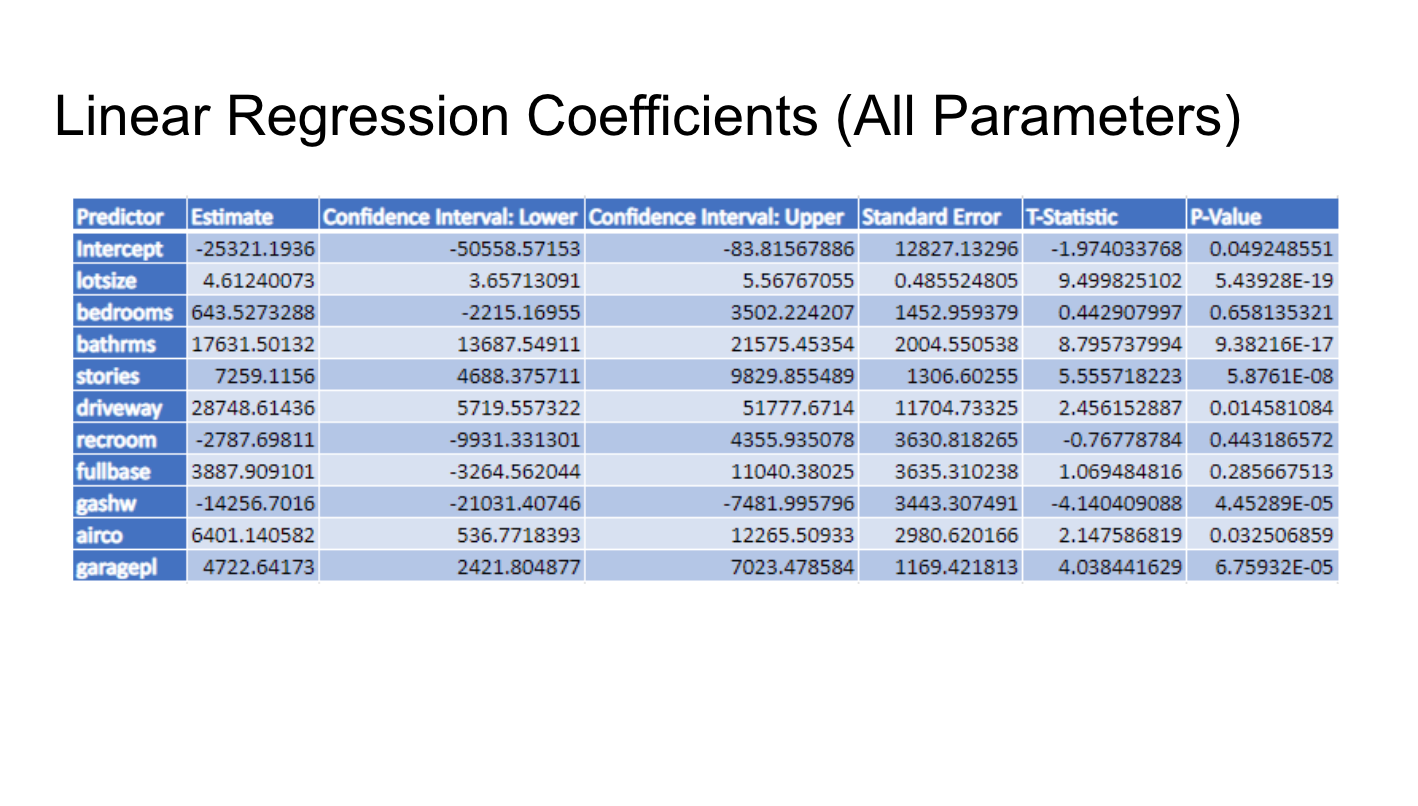
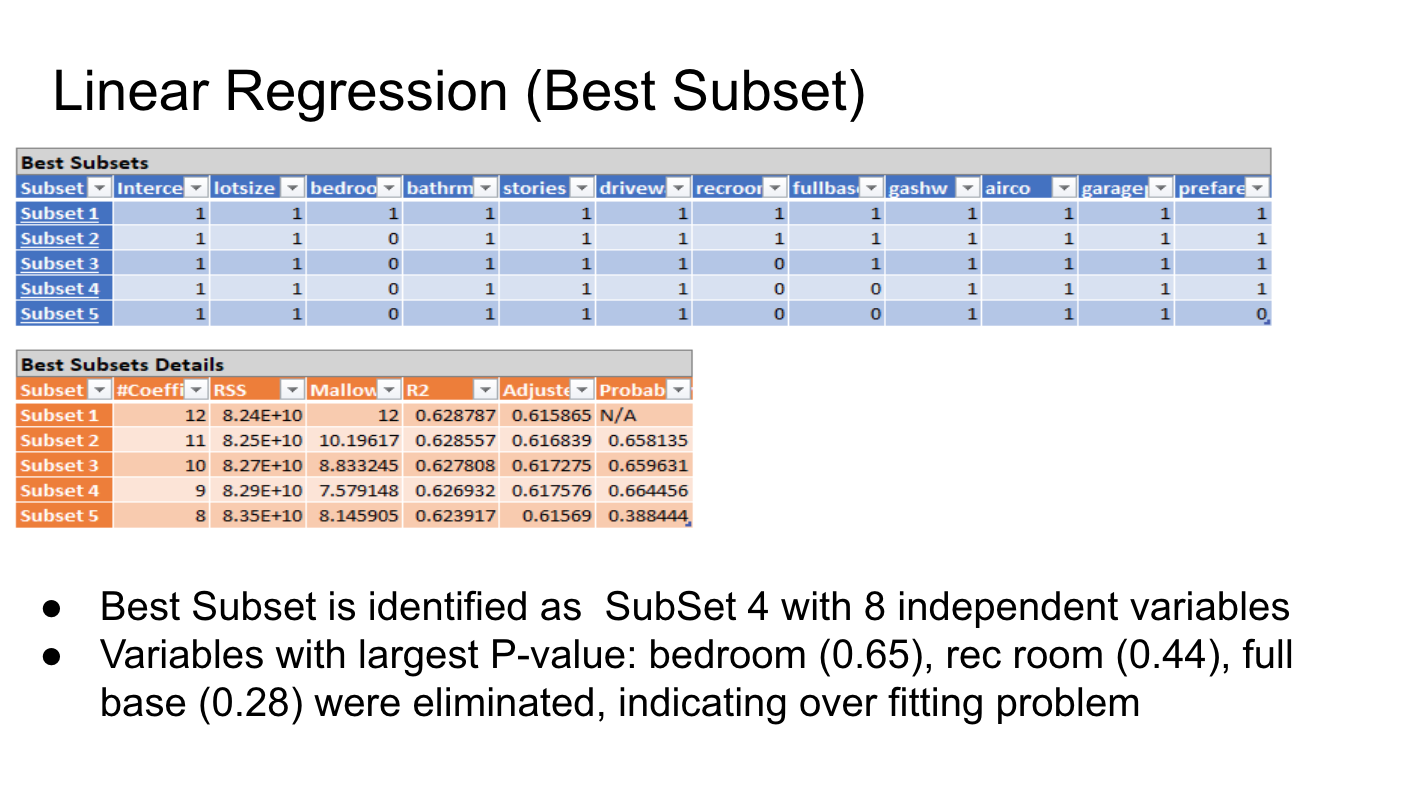
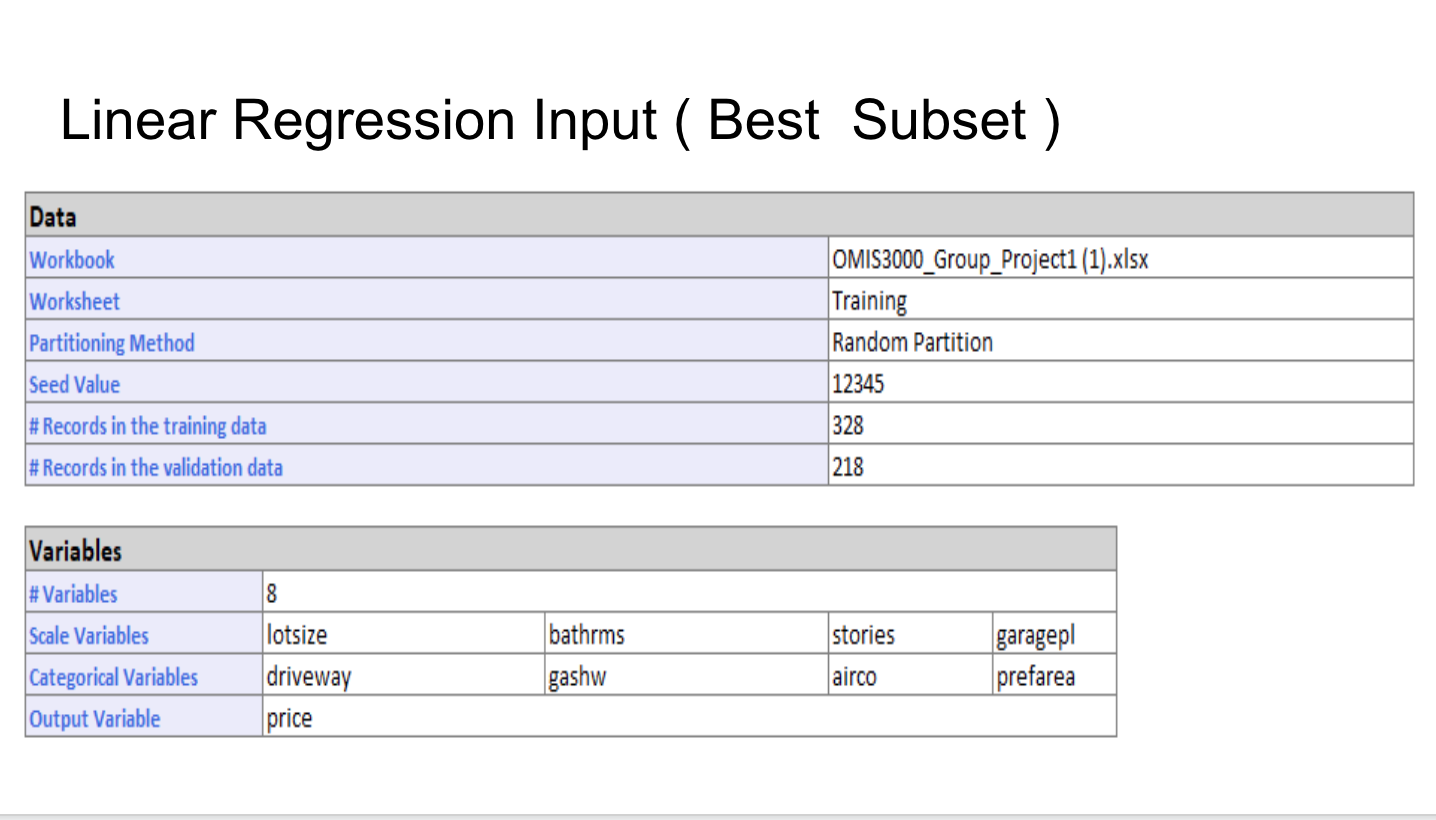
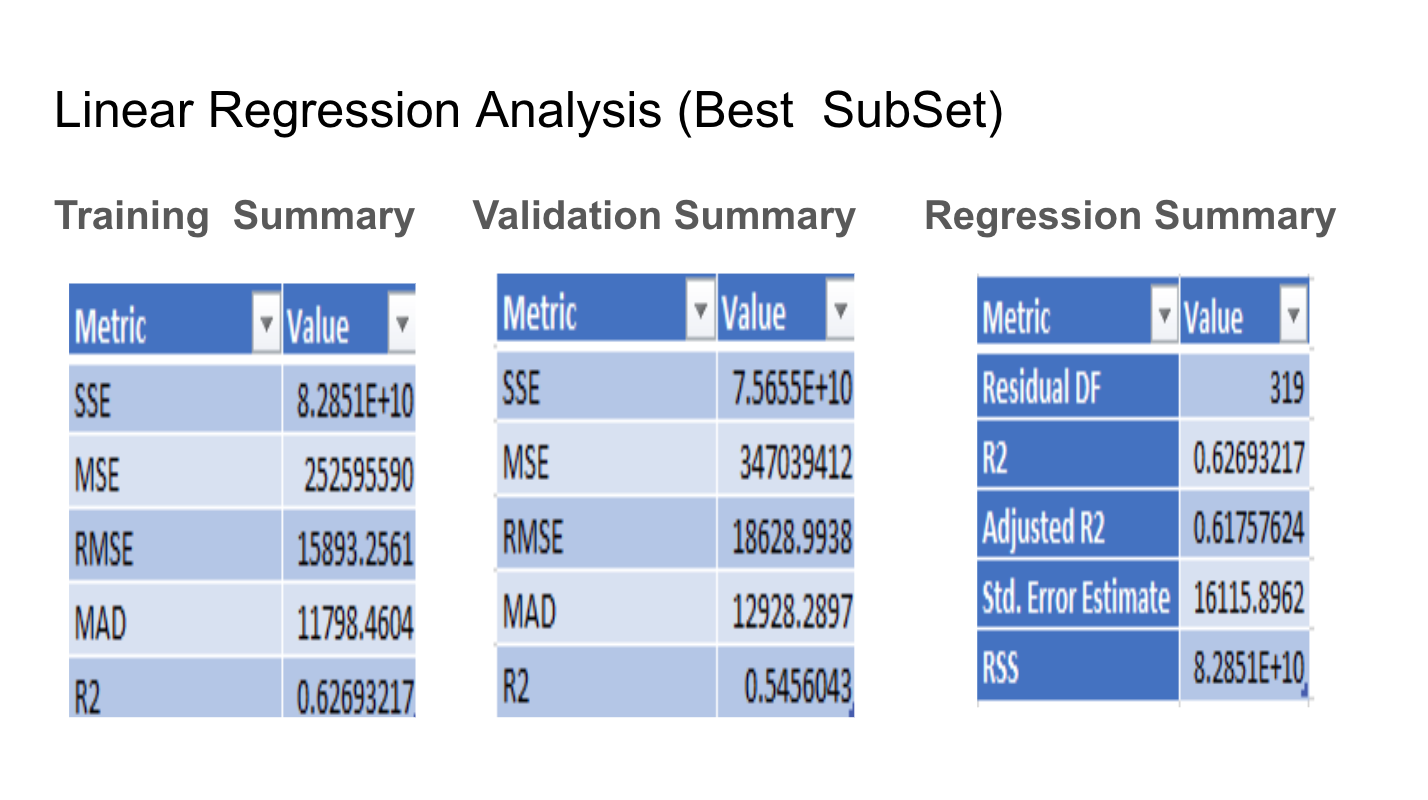
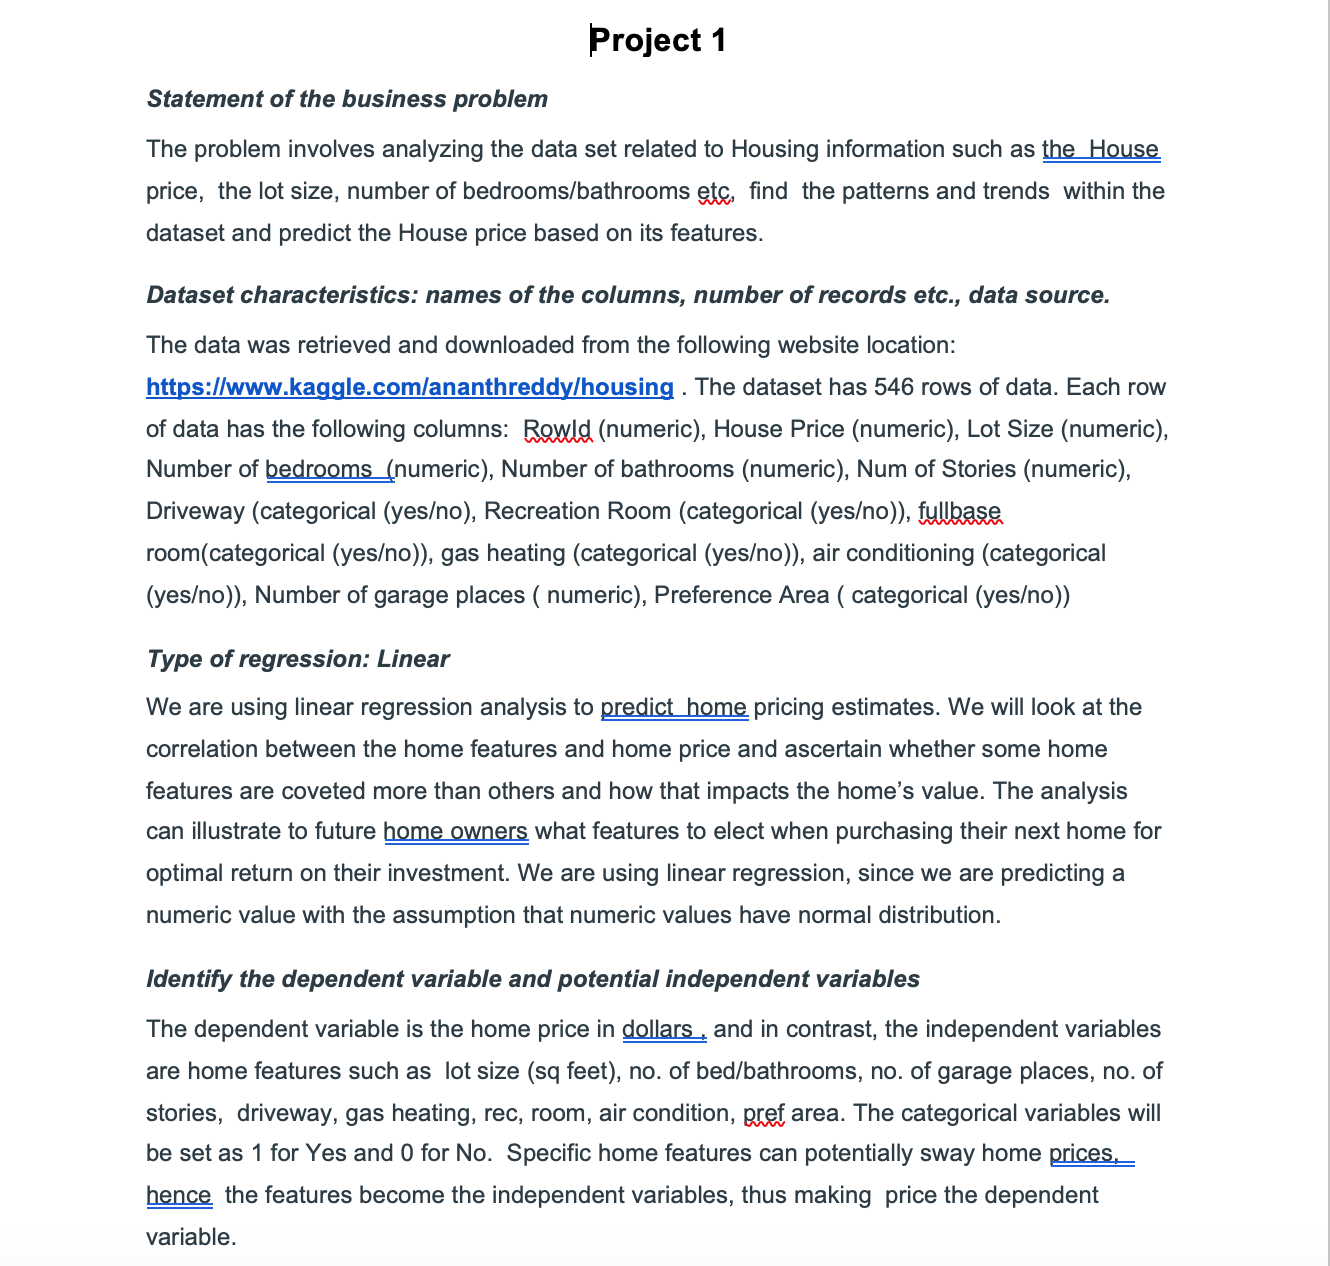
Linear Regression Input (All Parameters) Data Workbook OMIS3000_Group_Project1.xIsx Worksheet Training Partitioning Method Random Partition Seed Value 12345 # Records in the training data 328 # Records in the validation data 218 Variables # Variables 11 Scale Variables lotsize bedrooms bathrms stories driveway recroom fullbase gashw airco garagepl prefarea Cateanrical VariablesLinear Regression Analysis (All Parameters) Training Summary Validation Summary Regression Summary mm mm made a _ Residual or _ 0.628787 MSE 3E+CIB MSE BIZHEB Adjusted R2 11720 MAD 12375 Std. Error Estimate 16151.91 MAD o R2 Value for training set (0.62 ) is greater than R2 value for validation set as expected. Low R2 value indicates may not be a good linear regression t. There may be some missing variables 0 RMSE value of training set (15854) is comparable to that of validation set ( 16 % diff approx.) 0 Adjusted R2 value of (0.615) is less than R2 value of (0.62) 0 Average Price of home is 68121 and Standard Error in prediction 16151 indicates may be not a good regression fit with missing parameters Linear Regression Coefficients (All Parameters) Predictor Estimate Confidence Interval: Lower Confidence Interval: Upper Standard Error T-Statistic P-Value Intercept -25321.1936 -50558.57153 -83.81567886 12827.13296 -1.974033768 0.049248551 lotsize 4.61240073 3.65713091 5.56767055 0.485524805 9.499825102 5.43928E-19 bedrooms 643.5273288 -2215.16955 3502.224207 1452.959379 0.442907997 0.658135321 bathrms 17631.50132 13687.54911 21575.45354 2004.550538 8.795737994 9.38216E-17 stories 7259.1156 4688.375711 9829.855489 1306.60255 5.555718223 5.8761E-08 driveway 28748.61436 5719.557322 51777.6714 11704.73325 2.456152887 0.014581084 recroom -2787.69811 -9931.331301 4355.935078 3630.818265 -0.76778784 0.443186572 fullbase 3887.909101 -3264.562044 11040.38025 3635.310238 1.069484816 0.285667513 gashw -14256.7016 -21031.40746 -7481.995796 3443.307491 -4.140409088 4.45289E-05 airco 6401.140582 536.7718393 12265.50933 2980.620166 2.147586819 0.032506859 garagepl 4722.64173 2421.804877 7023.478584 1169.421813 4.038441629 6.75932E-05Linear Regression (Best Subset) Best Subsets Subset > Interce > lotsize > bedrooy bathrmy stories > drivew recroom fullbas gashw airco garage prefare Subset 1 Subset 2 0 1 1 1 1 Subset 3 H 1 HP Subset 4 1 OOH H Subset 5 1 0 1 0 Best Subsets Details Subset #Coeffi RSS Mallow |R2 Adjustey Probaby Subset 1 12 8.24E+10 12 0.628787 0.615865 N/A Subset 2 11 8.25+10 10.19617 0.628557 0.616839 0.658135 Subset 3 10 8.27E+10 8.833245 0.627808 0.617275 0.659631 Subset 4 9 8.29E+10 7.579148 0.626932 0.617576 0.664456 Subset 5 8 8.35E+10 8.145905 0.623917 0.61569 0.388444 . Best Subset is identified as SubSet 4 with 8 independent variables . Variables with largest P-value: bedroom (0.65), rec room (0.44), full base (0.28) were eliminated, indicating over fitting problemLinear Regression Input ( Best Subset ) Data Workbook OMIS3000_Group_Project1 (1).xIsx Worksheet Training Partitioning Method Random Partition Seed Value 12345 # Records in the training data 328 # Records in the validation data 218 Variables # Variables Co Scale Variables lotsize bathrms stories garagepl Categorical Variables driveway gashw airco prefarea Output Variable priceLinear Regression Analysis (Best SubSet) Training Summary Validation Summary Regression Summary Metric Value Metric Value Metric Value SSE 8.2851E+10 SSE 7.5655E+10 Residual DF 319 MSE 252595590 MSE 347039412 R2 0.62693217 RMSE 15893.2561 RMSE 18628.9938 Adjusted R2 0.61757624 MAD 11798.4604 MAD 12928.2897 Std. Error Estimate 16115.8962 RSS R2 0.62693217 R2 0.5456043 8.2851E+10Project 1 Statement of the business problem The problem involves analyzing the data set related to Housing information such as the House price, the lot size, number of bedrooms/bathrooms etc, find the patterns and trends within the dataset and predict the House price based on its features. Dataset characteristics: names of the columns, number of records etc., data source. The data was retrieved and downloaded from the following website location: https://www.kaggle.com/ananthreddy/housing . The dataset has 546 rows of data. Each row of data has the following columns: Rowld (numeric), House Price (numeric), Lot Size (numeric), Number of bedrooms (numeric), Number of bathrooms (numeric), Num of Stories (numeric), Driveway (categorical (yeso), Recreation Room (categorical (yeso)), fullbase room(categorical (yeso)), gas heating (categorical (yeso)), air conditioning (categorical (yeso)), Number of garage places ( numeric), Preference Area ( categorical (yeso)) Type of regression: Linear We are using linear regression analysis to predict home pricing estimates. We will look at the correlation between the home features and home price and ascertain whether some home features are coveted more than others and how that impacts the home's value. The analysis can illustrate to future home owners what features to elect when purchasing their next home for optimal return on their investment. We are using linear regression, since we are predicting a numeric value with the assumption that numeric values have normal distribution. Identify the dependent variable and potential independent variables The dependent variable is the home price in dollars , and in contrast, the independent variables are home features such as lot size (sq feet), no. of bed/bathrooms, no. of garage places, no. of stories, driveway, gas heating, rec, room, air condition, pref area. The categorical variables will be set as 1 for Yes and 0 for No. Specific home features can potentially sway home prices, hence the features become the independent variables, thus making price the dependent variable
Step by Step Solution
There are 3 Steps involved in it

Get step-by-step solutions from verified subject matter experts