

Question: Hi this is two different sets of data from a survey I conducted. Can you assist me in answering these questions. P Value and Optimism
Hi this is two different sets of data from a survey I conducted. Can you assist me in answering these questions.
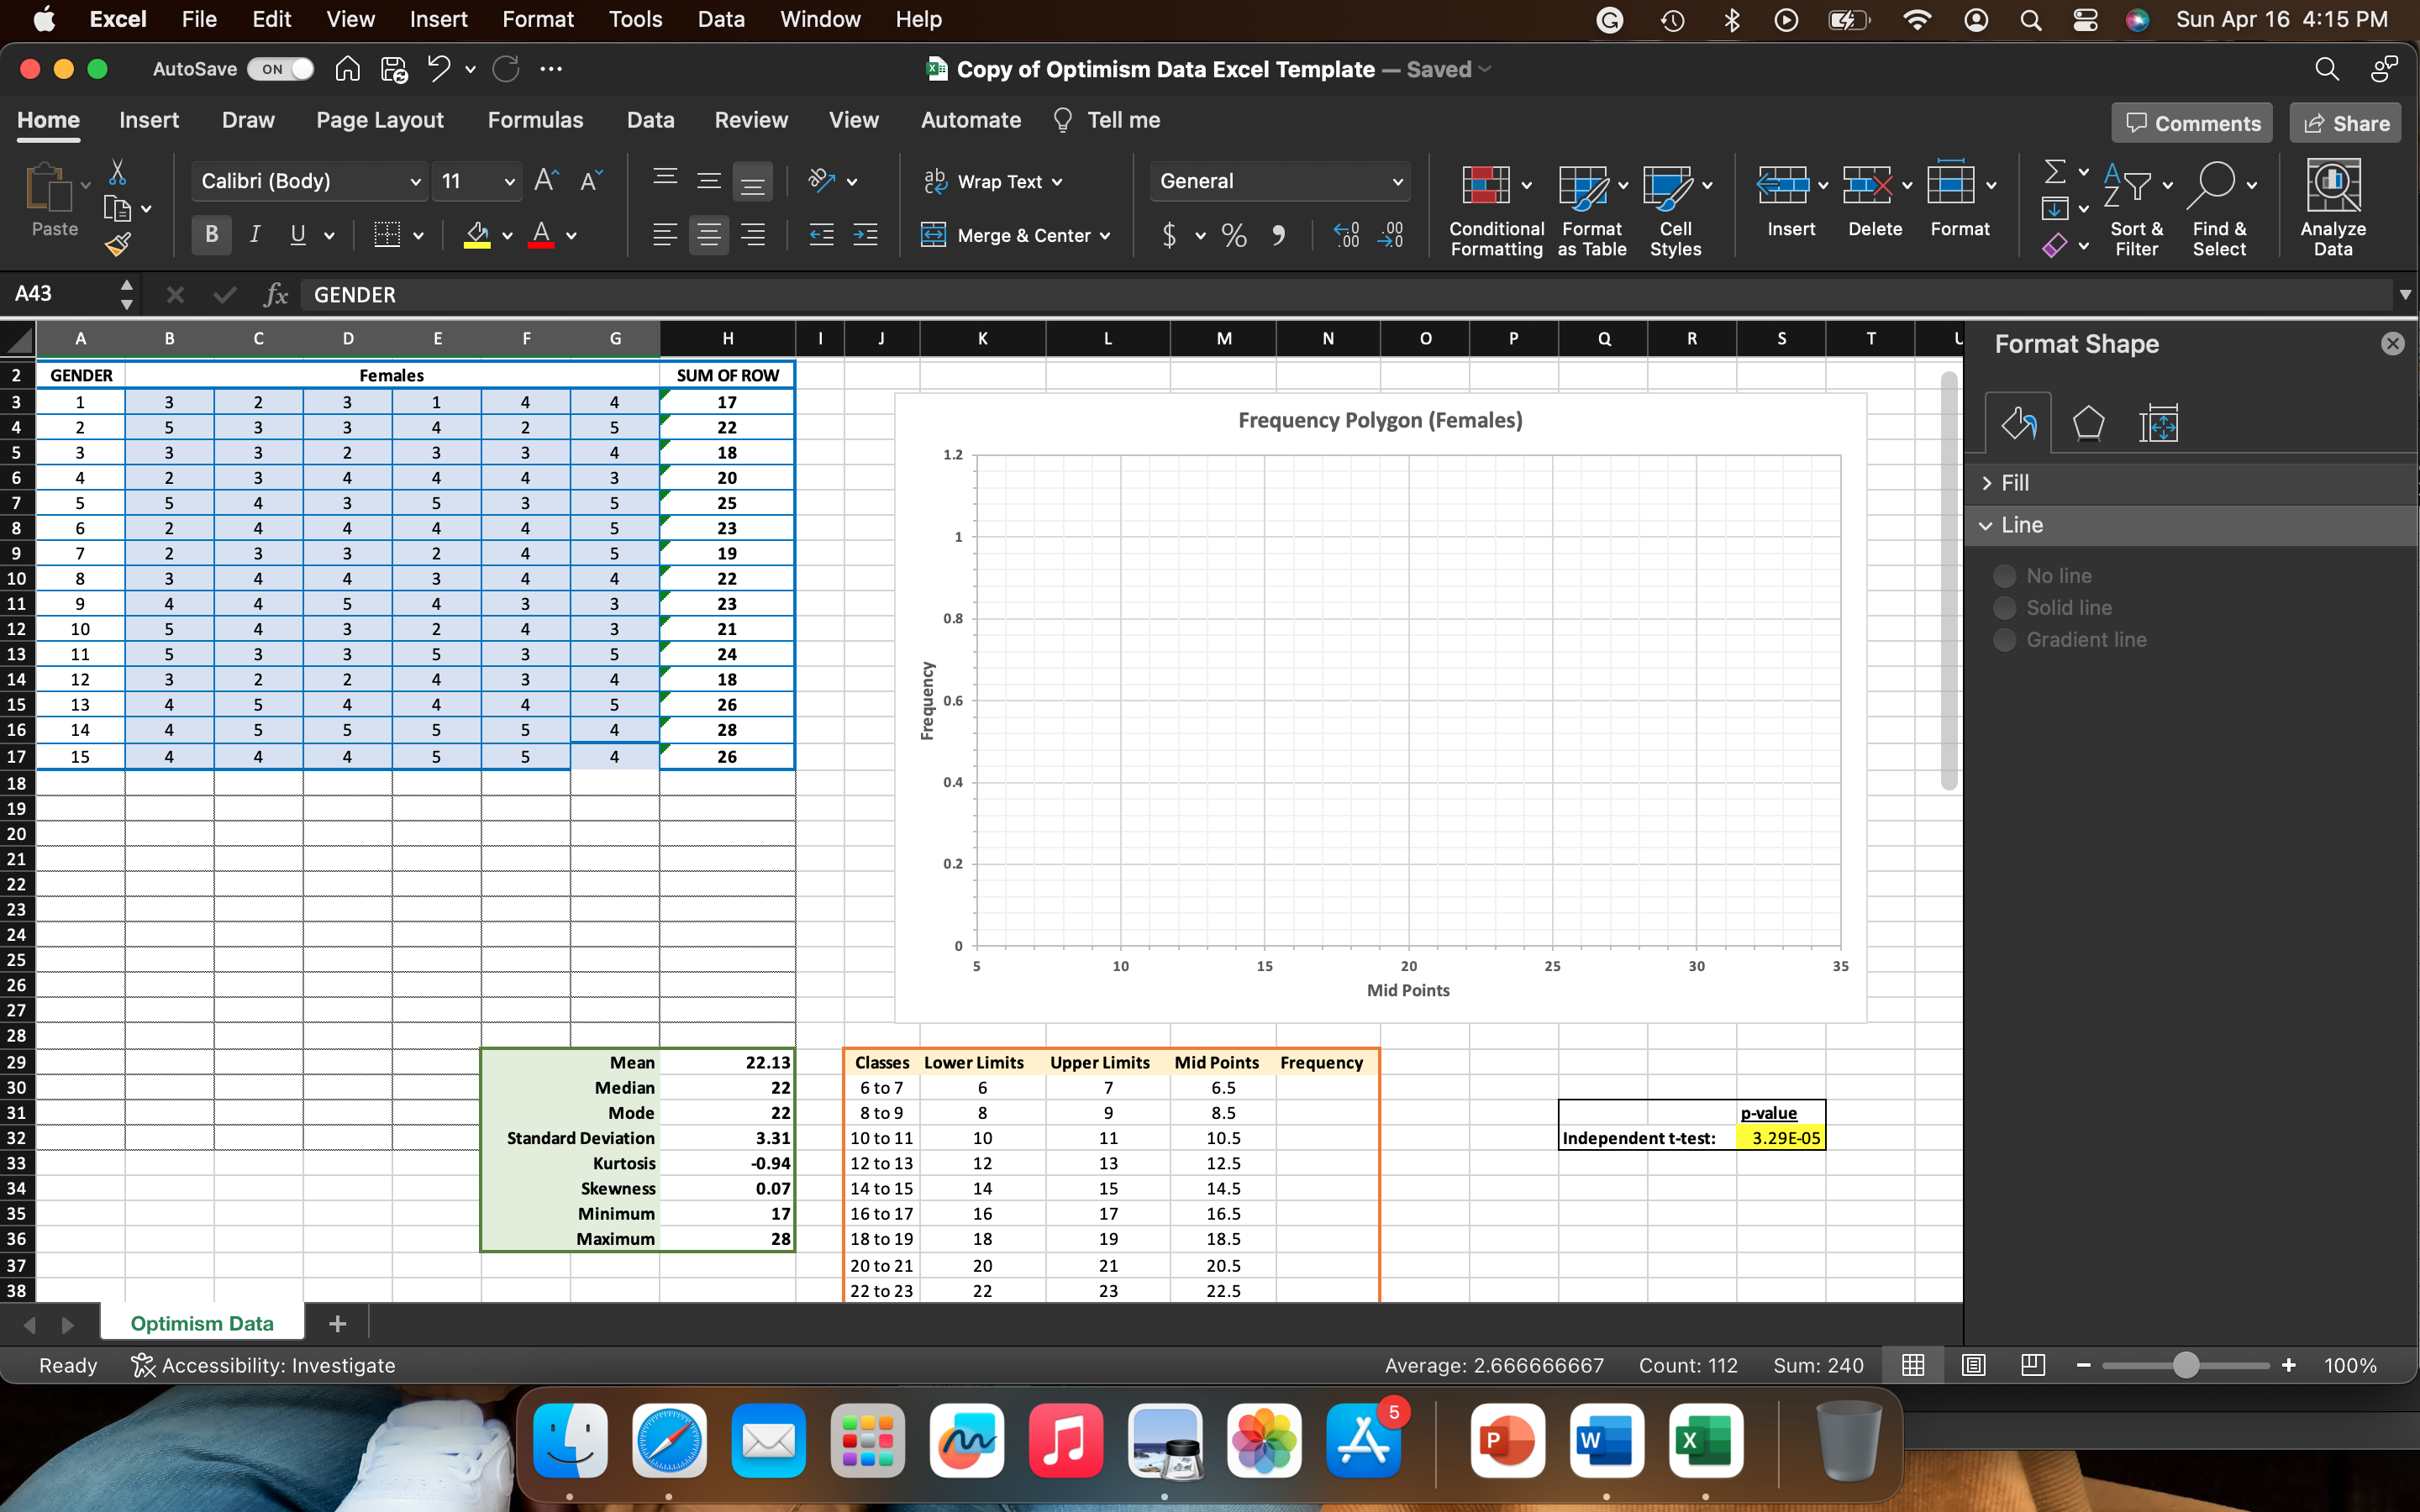
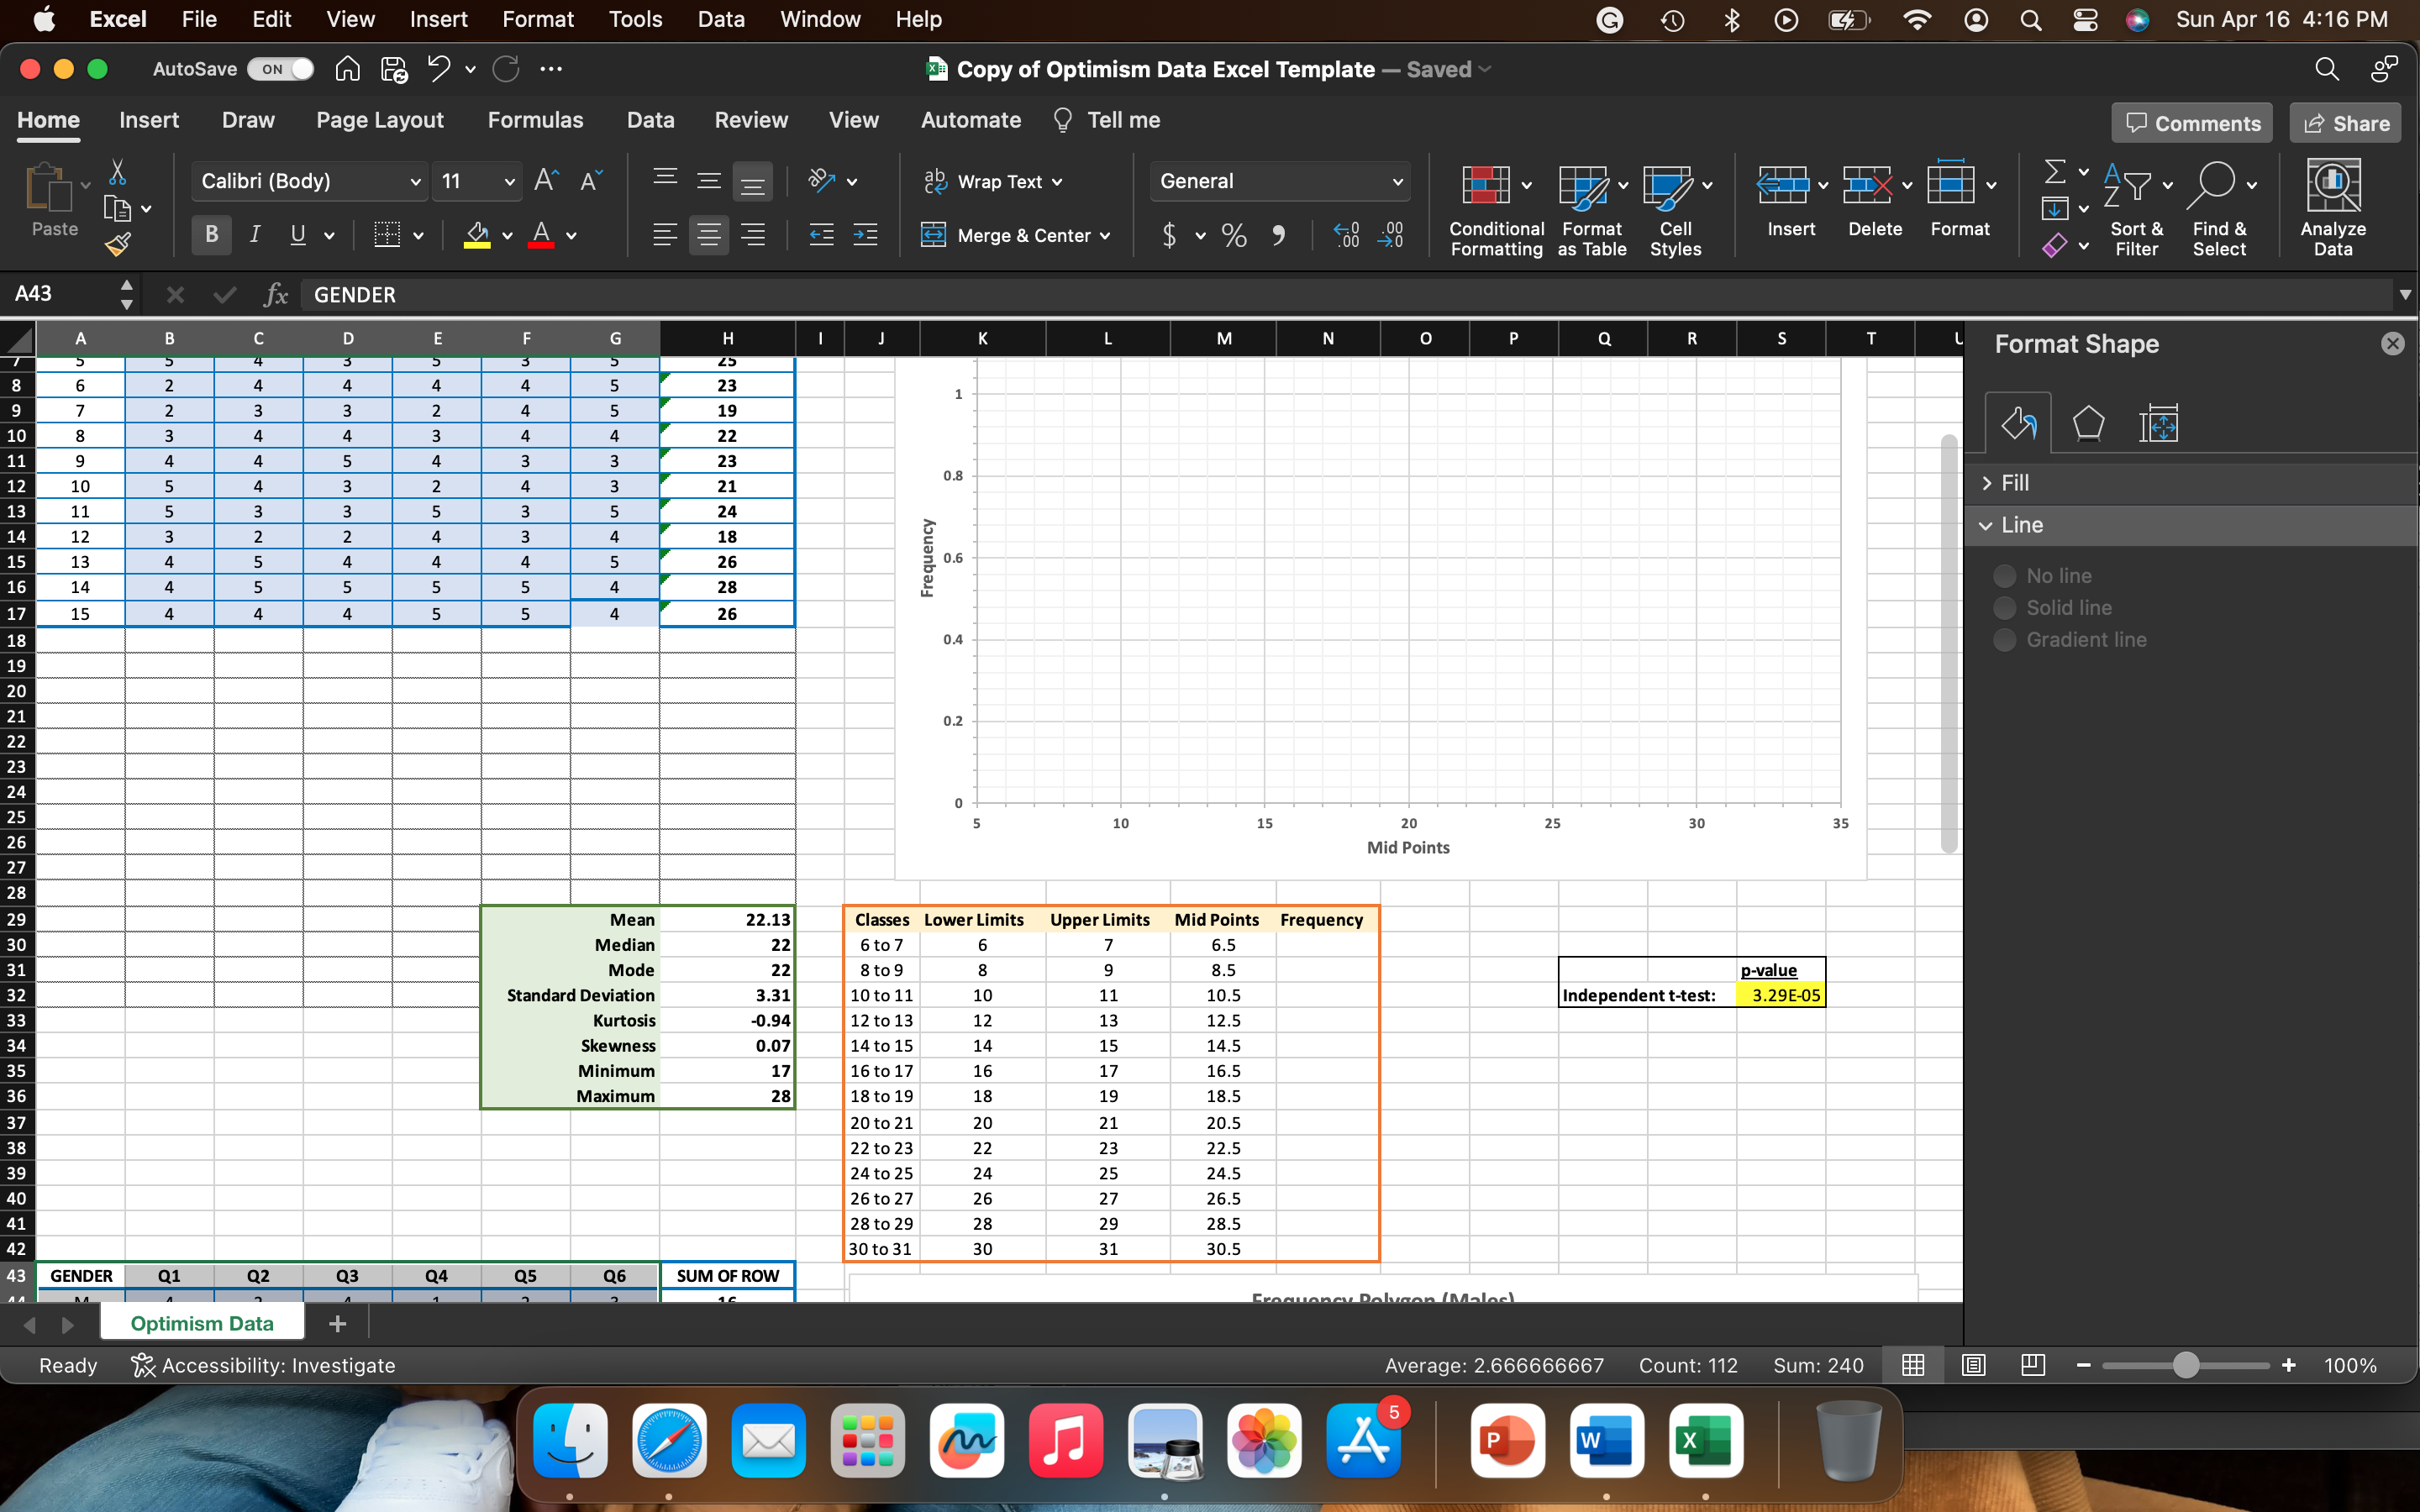
P Value and Optimism Study: a. After all your data is in the survey is submitted will see your p-value for your independent t-test populate. Remember this independent t-test is used to analyze if the difference between two groups is statistically significant. This test is based off of the 15 females and 15 males.
excel: =ttest(array 1, array 2, 2, 3). Note that for the array you would have to highlight the data values from the female and male category. This is a two-tail test and note that we are assuming normality. In your analysis you will state your null and alternative hypothesis and the decision based off of the p-value that was provided in the cell. We are testing this at a level of significance of 0.05
- Look at the mean, median, mode, and standard deviation and describe how these measures of central tendency indicates whether the distribution of men and women are normal or skewed. That is, is the distribution of men and women normal or skewed? How does the mean, median, and mode scores indicate if the distribution is normal or skewed?( Cite if you can please so I can refer to it)
- Look at the table of raw data for both men and women. Explain why the raw numbers indicate the distribution is normal or skewed. If the distributions are normal how would the scores have to change to yield a skewed distribution? If the distributions how would the scores have to change to yield a normal distribution.
Mens Data
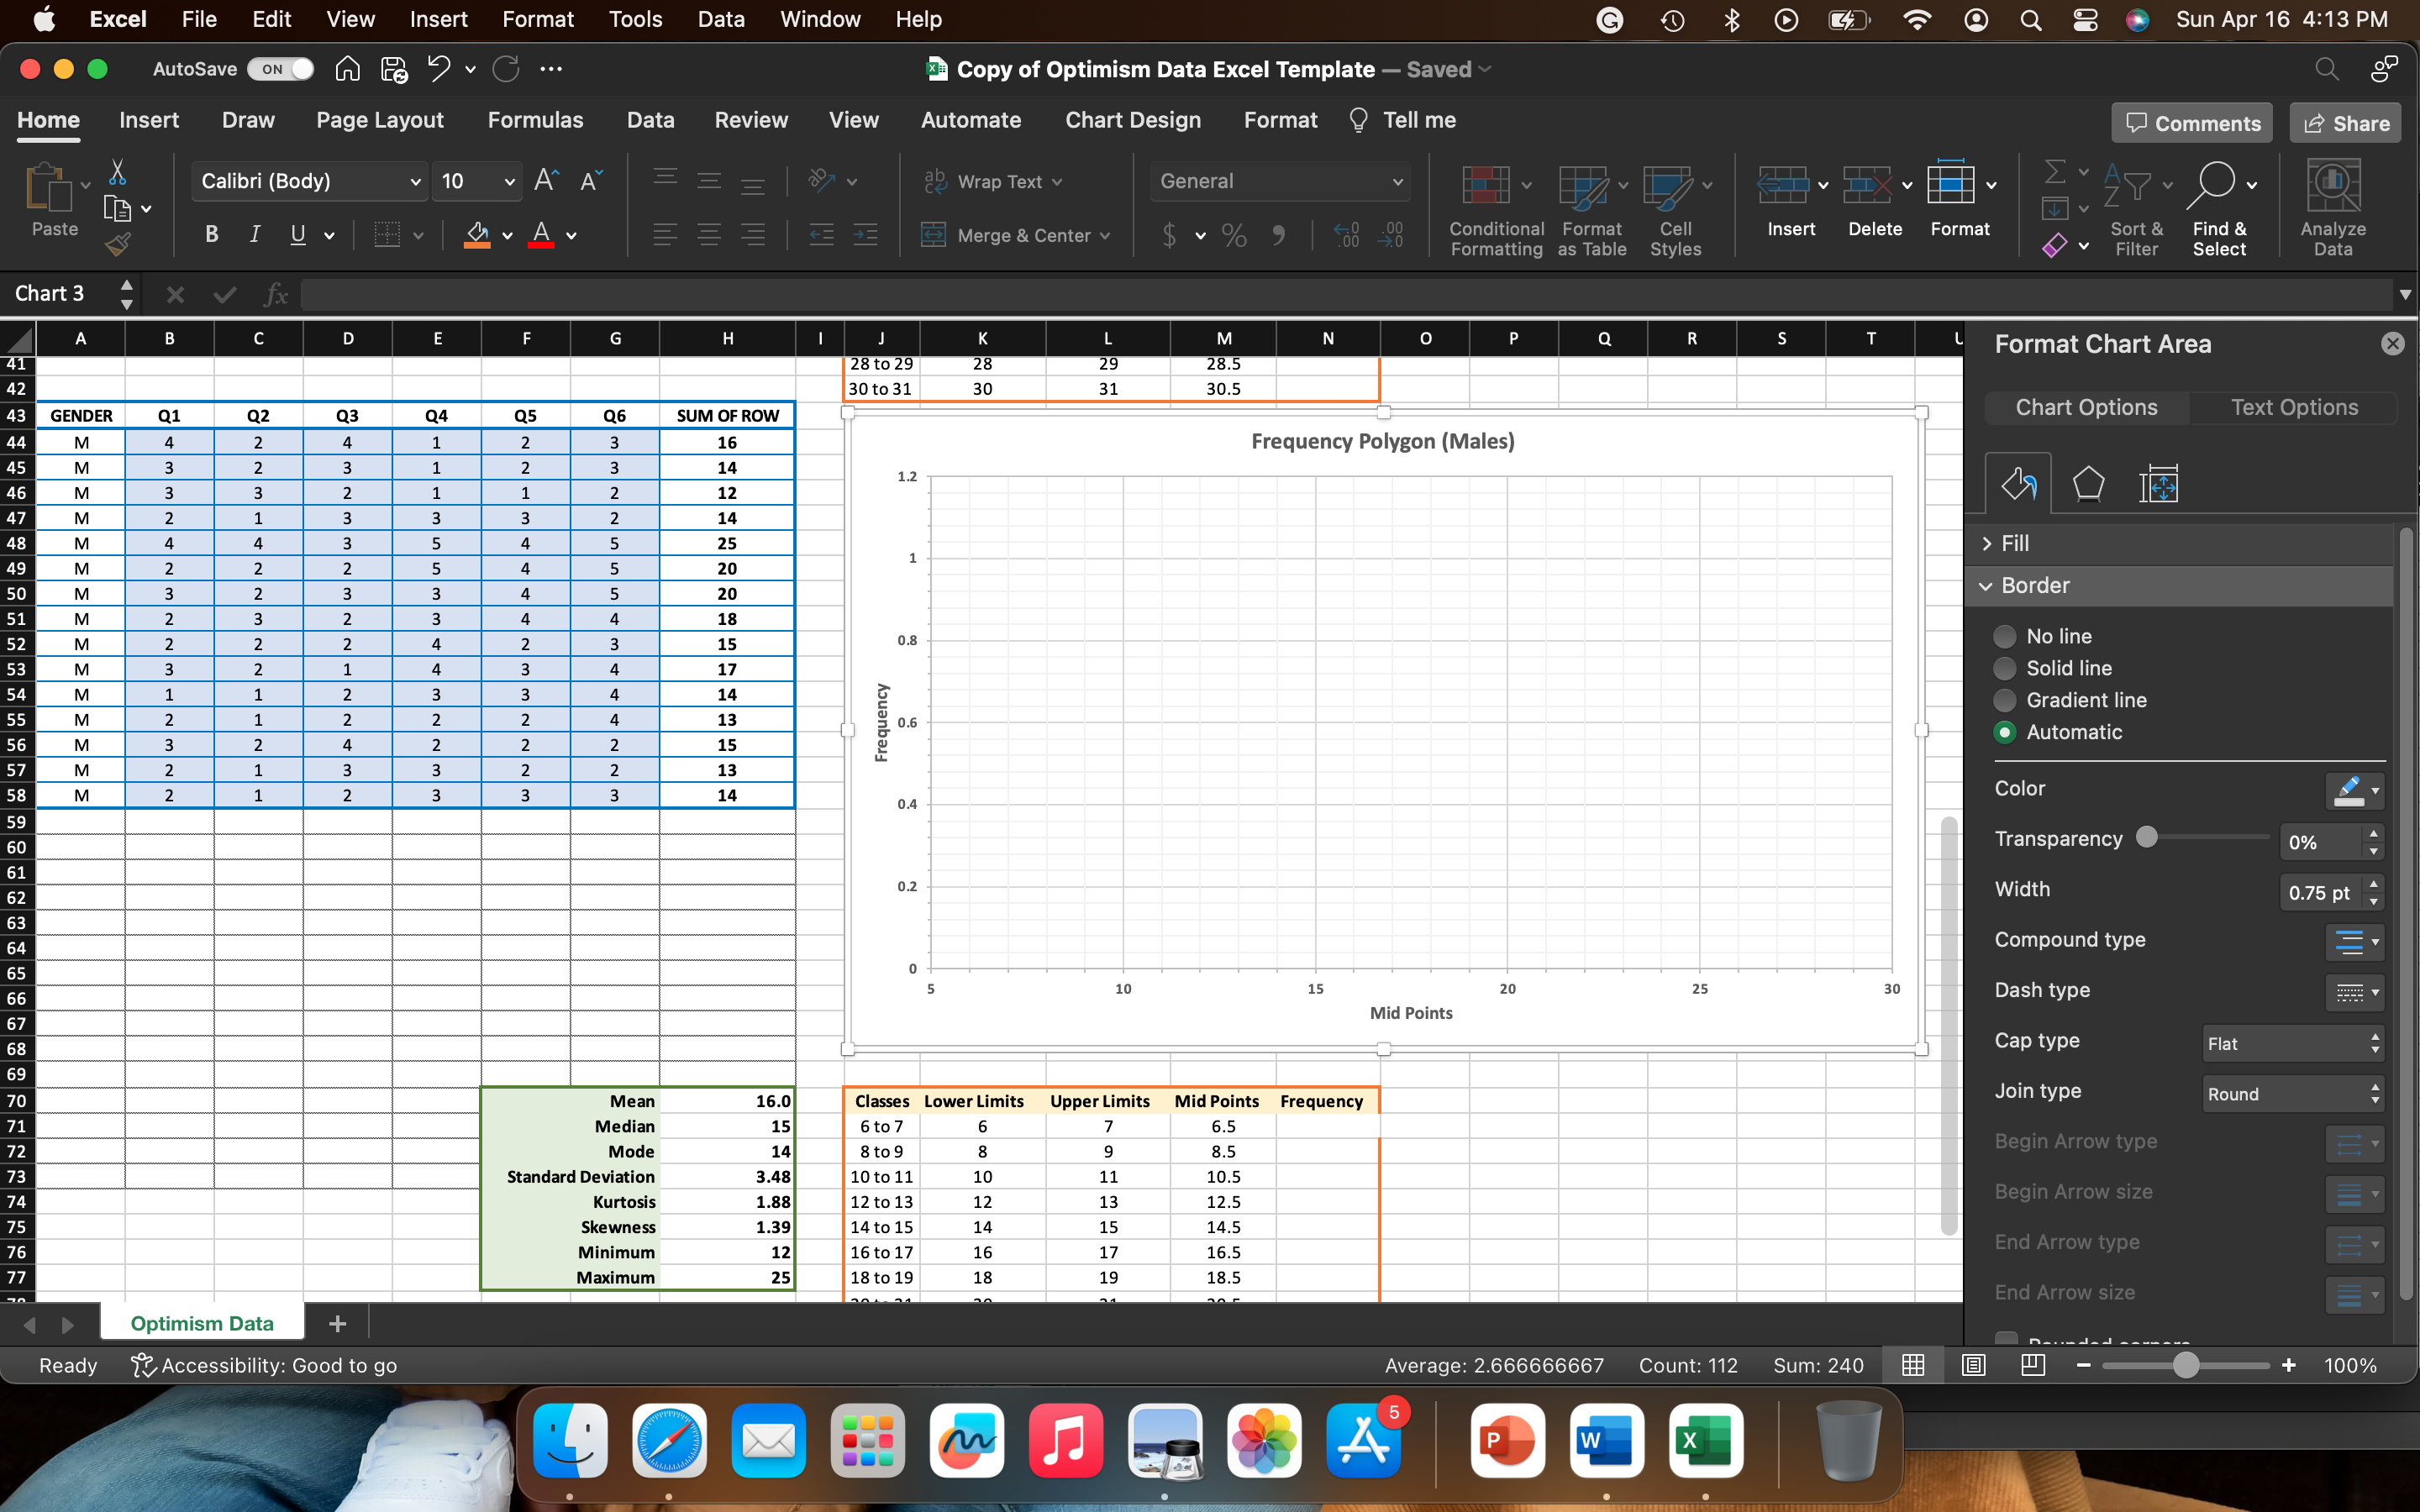
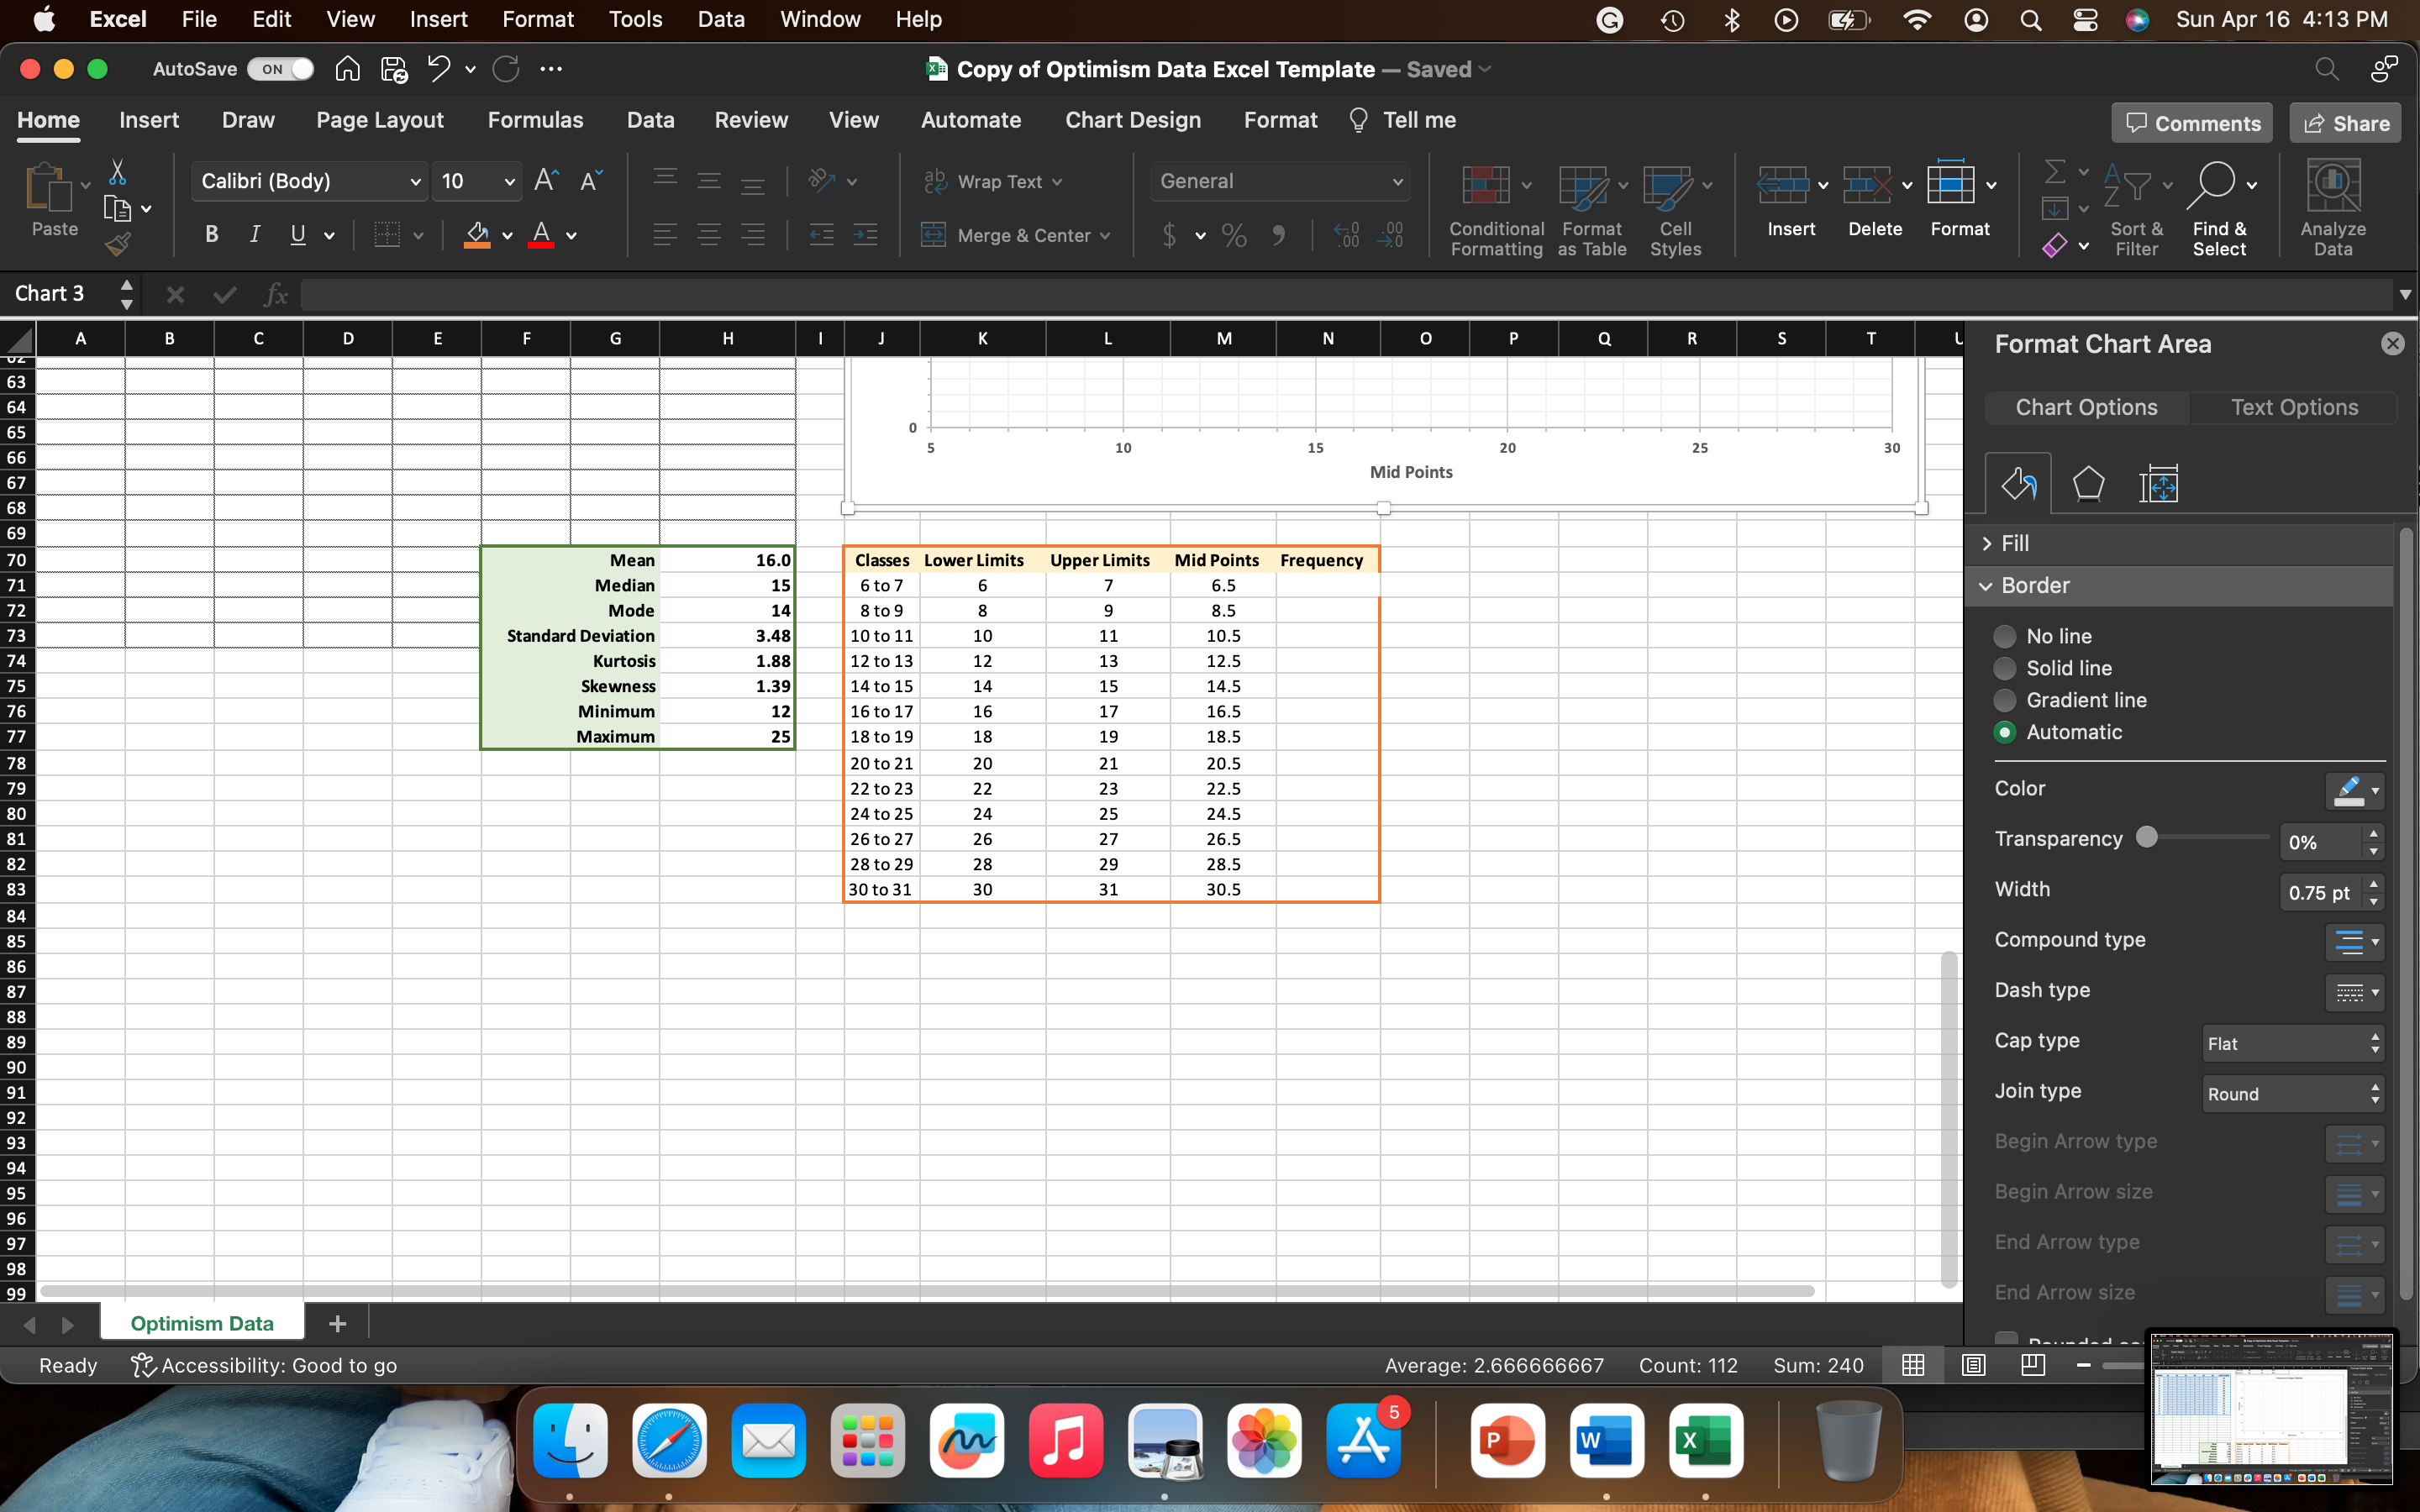
Excel File Edit View Insert Format Tools Data Window Help G O Q @ Sun Apr 16 4:13 PM AutoSave ON I F3 > ~ C ... Copy of Optimism Data Excel Template - Saved Home Insert Draw Page Layout Formulas Data Review View Automate Chart Design Format ? Tell me Comments LE Share X Calibri (Body) 10 AA ab Wrap Text v General NTTT V v Paste IUV E = KE FE Merge & Center v $ % " Conditional Format Cell Insert Delete Format Sort & Find & Analyze Formatting as Table Styles Filter Select Data Chart 3 X V fx B C D E F G H K L M N O P Q R Format Chart Area 28 to 29 28 28.5 30 to 31 30 30.5 Text Options GENDER Q1 Q5 SUM OF ROW Chart Options M 16 Frequency Polygon (Males) - W N N 14 1.2 D > Fill Border UN W N H W N N W N A N W W A W N N N W W N D D D A W H N N N W A N N H N N W N W W N W A W W N N W A A W W U U W H H H W N N A D A W A UI UI UI N N W W 3 3 3 3 3 3 3 3 3 3 3 3 3 3 0.8 No line Solid line HH NH L N N W N N F Gradient line Frequency 0.6 . Automatic Color 0.4 Transparency 0% 0.2 Width 0.75 pt Compound type 10 15 20 25 30 Dash type Mid Points Cap type Flat Join type Round Mean 16.0 Classes Lower Limits Upper Limits Mid Points Frequency Median 15 6 to 7 6 7 6.5 Mode 14 8 to 9 Begin Arrow type 8.5 00 Standard Deviation 3.48 10 to 11 11 10.5 Kurtosis 1.88 13 Begin Arrow size 12 to 13 12 12.5 Skewness 1.39 14 to 15 14 15 14.5 12 16 to 17 16 17 16.5 End Arrow type Minimum Maximum 25 18 to 19 18 19 18.5 End Arrow size Optimism Data + Pounded . Ready Accessibility: Good to go Average: 2.666666667 Count: 112 Sum: 240 + 100%Excel File Edit View Insert Format Tools Data Window Help G O Q @ Sun Apr 16 4:13 PM AutoSave ON I F3 2 ~ C ... Copy of Optimism Data Excel Template - Saved Home Insert Draw Page Layout Formulas Data Review View Automate Chart Design Format ? Tell me Comments LE Share X Calibri (Body) 10 AA ab Wrap Text v General NTT V v Paste BIUV A = FE Merge & Center v $ v % 9 08 08 Conditional Format Cell Insert Delete Format Sort & Find & Analyze Formatting as Table Styles Filter Select Data Chart 3 X V fx B C D E F G H J K M N P Q R S Format Chart Area Chart Options Text Options 10 15 20 25 30 Mid Points D > Fill Mean 16.0 Classes Lower Limits Upper Limits Mid Points Frequency Median 15 6 to 7 6 7 6.5 Border Mode 14 8 to 9 8.5 Standard Deviation 3.48 10 to 11 11 10.5 No line Kurtosis 1.88 12 to 13 12 13 12.5 Solid line Skewness 1.39 14 to 15 14 15 14.5 Minimum 12 16 to 17 16 17 16.5 Gradient line Maximum 25 18 to 19 18 19 18.5 . Automatic 20 to 21 20 21 20.5 22 to 23 22 23 22.5 Color 24 to 25 24 25 24.5 26 to 27 26 27 26.5 Transparency 0% 28 to 29 28 29 28.5 30 to 31 30 31 30.5 Width 0.75 pt Compound type Dash type Cap type Flat Join type Round Begin Arrow type Begin Arrow size End Arrow type 98 End Arrow size Optimism Data + Rounded - Ready Accessibility: Good to go Average: 2.666666667 Count: 112 Sum: 240 AExcel File Edit View Insert Format Tools Data Window Help G Q @ Sun Apr 16 4:15 PM AutoSave ON I F3 ~ C ... Copy of Optimism Data Excel Template - Saved Home Insert Draw Page Layout Formulas Data Review View Automate Tell me Comments Share X Calibri (Body) 11 AA = ab Wrap Text v General AP - OV Paste B IUV A Merge & Center v $ ~ % 9 00 0 Conditional Format Cell Insert Delete Format Sort & Find & Analyze Formatting as Table Styles Filter Select Data A43 X V fx GENDER B C D E F G H K M N P Q R Format Shape X GENDER Females SUM OF ROW 17 22 Frequency Polygon (Females) W W W N 18 1.2 20 Fill 25 23 Line A A W UI UI A W N N U N W V W No line U UI D AUIN A W N A VIA W A H U U D W W D W A D D W A W N A U A N W W U A W A W A N W Solid line 0.8 Gradient line AUT UI N W A A D Frequency 0.6 0.4 0.2 10 15 20 25 30 35 Mid Points Mean 22.13 Classes Lower Limits Upper Limits Mid Points Frequency Media 22 6 to 7 6 6.5 Mode 22 8 to S 8 8.5 p-value Standard Deviation 3.31 10 to 11 11 10.5 Independent t-test: 3.29E-05 Kurtosis 0.94 12 to 13 12 13 12.5 Skewness 0.07 14 to 15 14 15 14.5 Minimum 17 16 to 17 16 17 16.5 Maximum 28 18 to 19 18 19 18.5 20 to 21 20 21 20.5 38 22 to 23 22 23 22.5 Optimism Data + Ready ux Accessibility: Investigate Average: 2.666666667 Count: 112 Sum: 240 + 100%Excel File Edit View Insert Format Tools Data Window Help G Q 8 Sun Apr 16 4:16 PM AutoSave ON I F3 ~ C ... Copy of Optimism Data Excel Template - Saved Home Insert Draw Page Layout Formulas Data Review View Automate Tell me Comments Share X Calibri (Body) 11 AA E ab Wrap Text v General AP - OV Paste B IUV A Merge & Center v $ ~ % 9 00 0 Conditional Format Cell Insert Delete Format Sort & Find & Analyze Formatting as Table Styles Filter Select Data A43 X V fx GENDER B C H J K M N P Q R m Format Shape X 25 23 AWN NU 19 AU A VI W W D UI VI U 10 0.8 Fill uni UT UI UI A A UI N A W N U A N W W VI P Line UI UT A W W A W UI UI N W A D Frequency 0.6 14 No line 15 Solid line 0.4 Gradient line 0.2 10 15 20 25 30 35 Mid Points Mean 22.13 Classes Lower Limits Upper Limits Mid Points Frequency Median 22 6 to 7 6 6.5 Mode 22 8 to 8.5 p-value Standard Deviation 3.31 10 to 11 11 10.5 Independent t-test: 3.29E-05 Kurtosis 0.94 12 to 13 12 13 12.5 Skewness 0.07 14 to 15 14 15 14.5 Minimum 17 16 to 17 16 17 16.5 Maximum 28 18 to 19 18 19 18.5 20 to 21 20 21 20.5 22 to 23 22 23 22.5 24 to 25 24 25 24.5 26 to 27 26 27 26.5 28 to 29 28 29 28.5 30 to 31 30 31 30.5 43 GENDER Q1 Q2 Q3 Q4 Q5 Q6 SUM OF ROW Optimism Data + Ready ux Accessibility: Investigate Average: 2.666666667 Count: 112 Sum: 240 + 100% A
Step by Step Solution
There are 3 Steps involved in it

Get step-by-step solutions from verified subject matter experts