

Question: High frequency capacitance versus voltage plots for a metal - insulator - semiconductor ( MIS ) structure are shown at the right ( NdF 3
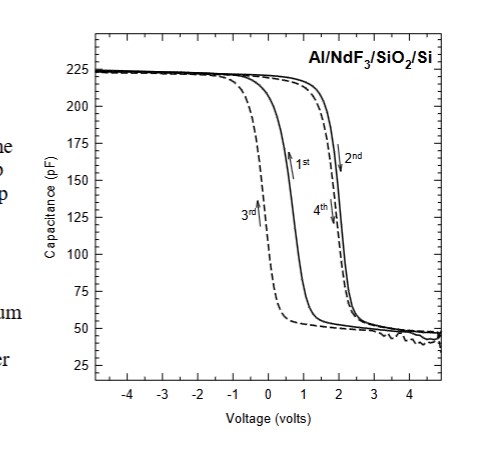
High frequency capacitance versus voltage plots for a
metalinsulatorsemiconductor MIS structure are
shown at the right NdF and SiO comprise the
insulator Four voltage sweeps are indicated where the
bias is applied to the aluminum metal. The first sweep
starts at volts and ends at volts, the second sweep
is in the opposite direction, and the third and fourth
voltage sweeps repeat this cycle
Note that the nd and th CV curves exhibit a flatband voltage of about volts. Assuming the
NdFSiO insulator has a bandgap of about eV draw an accuratelyscaled band diagram at
equilibrium for this MIS structure after the nd or th voltage sweep. Hint: First draw the band
diagram with volts applied to the metal.AlNdFSiOSi
Step by Step Solution
There are 3 Steps involved in it
1 Expert Approved Answer
Step: 1 Unlock

Question Has Been Solved by an Expert!
Get step-by-step solutions from verified subject matter experts
Step: 2 Unlock
Step: 3 Unlock