

Question: High-Low Method, Scatterplot, Regression Weber Valley Regional Hospital has collected data on all of its activities for the past 16 months. Data for cardiac nursing
High-Low Method, Scatterplot, Regression
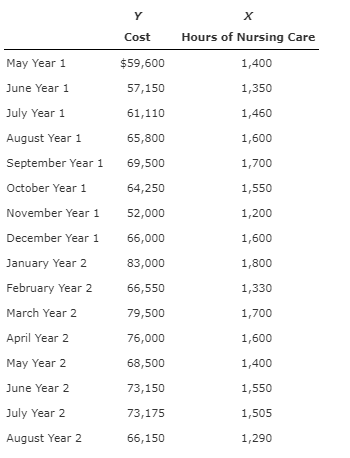
Weber Valley Regional Hospital has collected data on all of its activities for the past 16 months. Data for cardiac nursing care follow:
Required:
In the computations below, use intercepts rounded to the nearest whole number and use X variable coefficients rounded to 2 decimal places.
1. Using the high-low method, calculate the variable rate per hour and the fixed cost for the nursing care activity. Enter negative answers with a minus sign.
Y = $ 10,006 + $ 51.67
2. Run a regression on the data, using hours of nursing care as the independent variable. Predict cost for the cardiac nursing care for September Year 2 if 1,400 hours of nursing care are forecast. If required, round your answer to the nearest dollar.
Y = $63,696
3. Upon looking into the events that happened at the end of Year 1, you find that the cardiology ward bought a cardiac-monitoring machine for the nursing station. Administrators also decided to add a new supervisory position for the evening shift. Monthly depreciation on the monitor and the salary of the new supervisor together total $10,000. Now, run two regression equations, one for the observations from Year 1 and the second using only the observations for the eight months in Year 2. What is your predicted cost of the cardiac nursing care activity for September Year 2 if 1,400 hours of nursing care are forecast? When required, round your answer to two decimal places.
Y = ?????????? (69031 is wrong)
What is ???
Hours of Nursing Care Cost 1,400 1,350 1,460 1,600 1,700 1,550 1,200 1,600 1,800 1,330 1,700 1,600 1,400 1,550 1,505 1,290 May Year 1 June Year 1 July Year1 August Year 1 September Year 1 October Year 1 November Year 1 December Year 1 January Year 2 February Year 2 March Year 2 April Year 2 May Year 2 June Year 2 July Year2 August Year 2 $59,600 57,150 61,110 65,800 69,500 64,250 52,000 66,000 83,000 66,550 79,500 76,000 68,500 73,150 73,175 66,150
Step by Step Solution
There are 3 Steps involved in it

Get step-by-step solutions from verified subject matter experts