

Question: hii I would really appreciate it if u solve both parts as they're not long and ill make sure to thumbs it up. thanks! Annual
hii I would really appreciate it if u solve both parts as they're not long and ill make sure to thumbs it up. thanks!
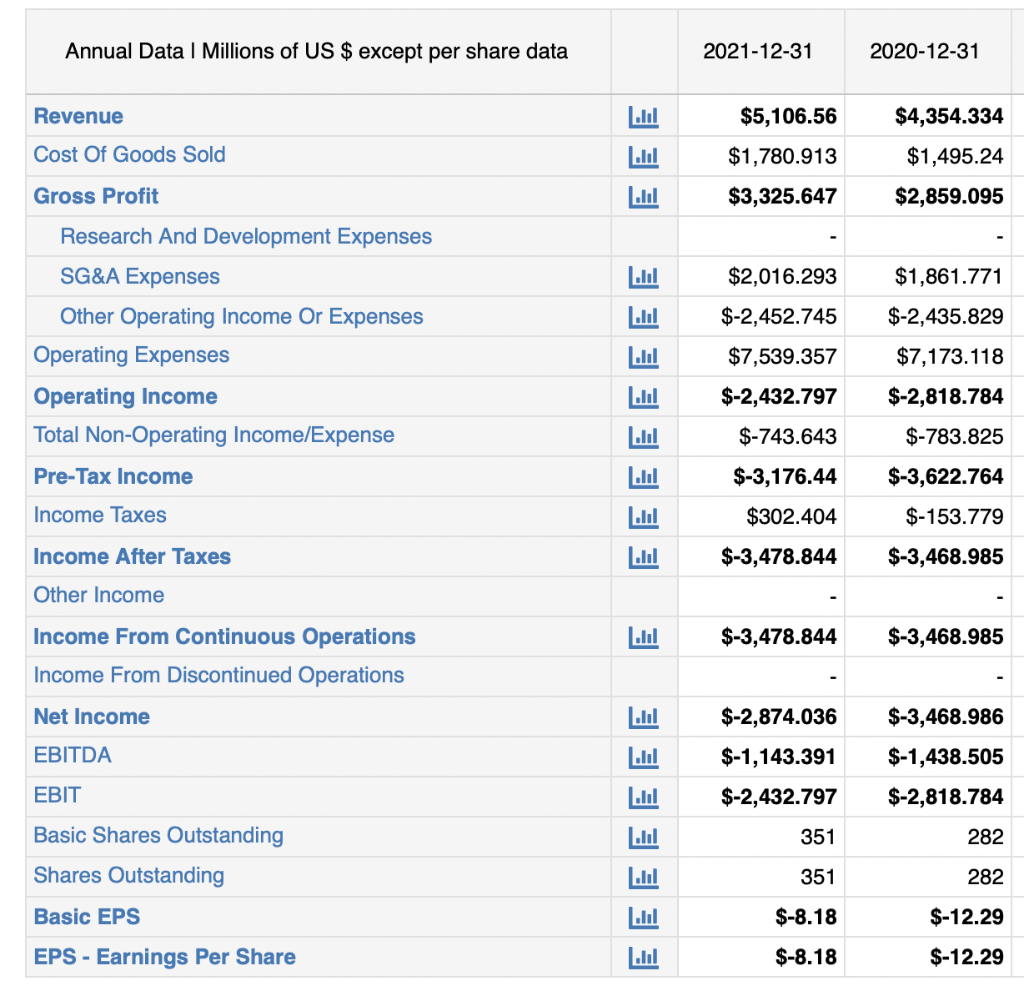
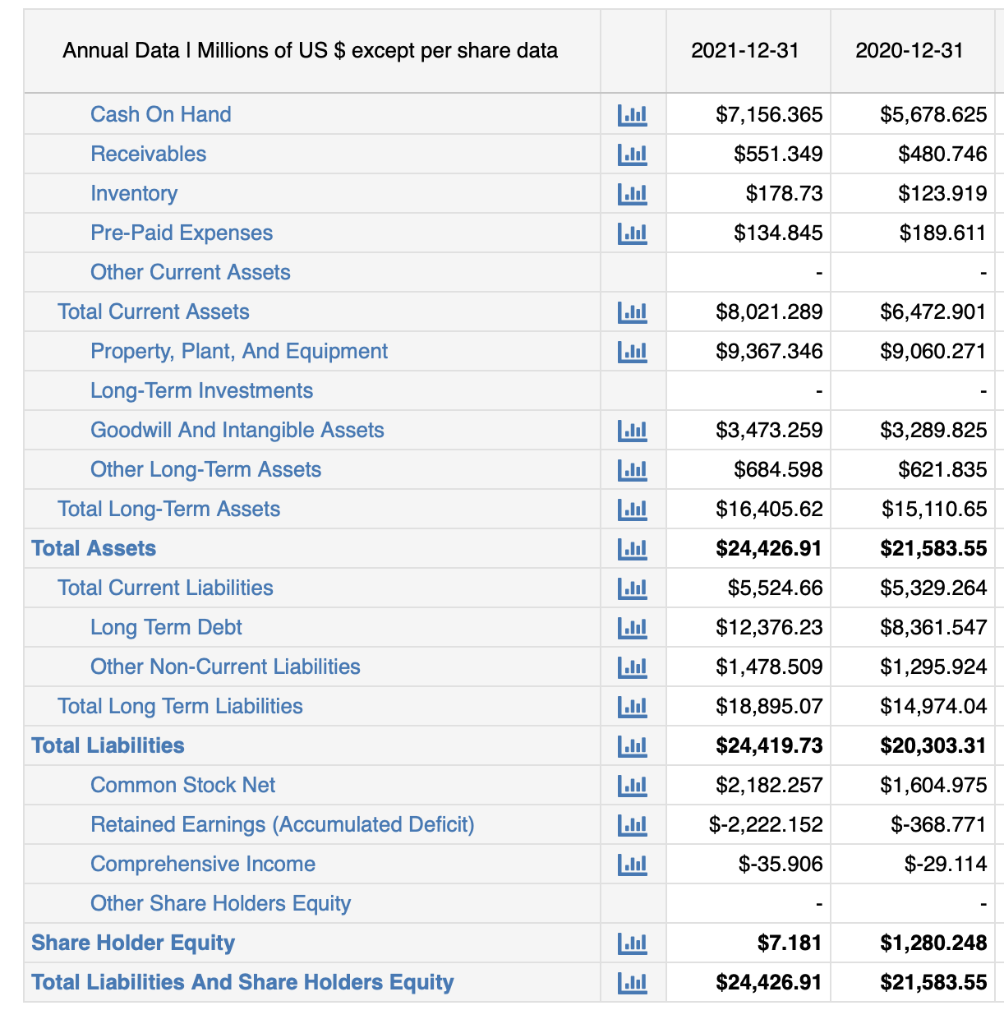
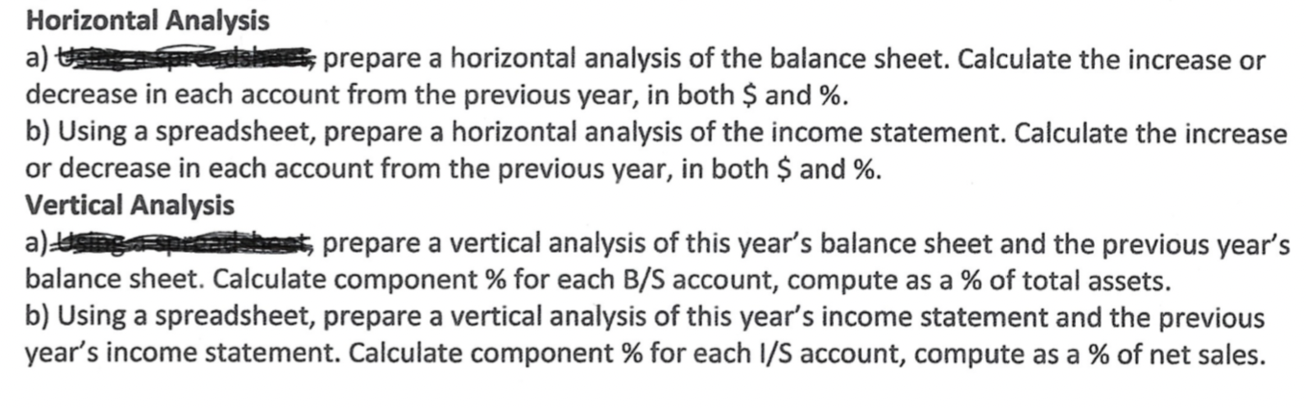
Annual Data | Millions of US $ except per share data Revenue Cost Of Goods Sold Gross Profit Research And Development Expenses SG&A Expenses Other Operating Income Or Expenses Operating Expenses Operating Income Total Non-Operating Income/Expense Pre-Tax Income Income Taxes Income After Taxes Other Income Income From Continuous Operations Income From Discontinued Operations Net Income EBITDA EBIT Basic Shares Outstanding ares Outstanding Basic EPS EPS - Earnings Per Share EEE EE ..... ..... ..... EEEEE 3 .... EEEEEEE 2021-12-31 2020-12-31 $5,106.56 $4,354.334 $1,780.913 $1,495.24 $3,325.647 $2,859.095 $2,016.293 $1,861.771 $-2,452.745 $-2,435.829 $7,539.357 $7,173.118 $-2,432.797 $-2,818.784 $-743.643 $-783.825 $-3,176.44 $-3,622.764 $302.404 $-153.779 $-3,478.844 $-3,468.985 $-3,478.844 $-3,468.985 $-2,874.036 $-3,468.986 $-1,143.391 $-1,438.505 $-2,432.797 $-2,818.784 351 282 351 282 $-8.18 $-12.29 $-8.18 $-12.29 Annual Data I Millions of US $ except per share data Cash On Hand Receivables Inventory Pre-Paid Expenses Other Current Assets Property, Plant, And Equipment Long-Term Investments Goodwill And Intangible Assets Other Long-Term Assets Total Current Assets Total Long-Term Assets Total Current Liabilities Long Term Debt Other Non-Current Liabilities Total Long Term Liabilities Common Stock Net Retained Earnings (Accumulated Deficit) Comprehensive Income Other Share Holders Equity Share Holder Equity Total Liabilities And Share Holders Equity Total Assets Total Liabilities EEEE EE EEEEE Lul ..... ..... ..... E ..... LA 3 ..... 2021-12-31 $7,156.365 $551.349 $178.73 $134.845 $8,021.289 $9,367.346 $3,473.259 $684.598 $16,405.62 $24,426.91 $5,524.66 $12,376.23 $1,478.509 $18,895.07 $24,419.73 $2,182.257 $-2,222.152 $-35.906 $7.181 $24,426.91 2020-12-31 $5,678.625 $480.746 $123.919 $189.611 $6,472.901 $9,060.271 $3,289.825 $621.835 $15,110.65 $21,583.55 $5,329.264 $8,361.547 $1,295.924 $14,974.04 $20,303.31 $1,604.975 $-368.771 $-29.114 $1,280.248 $21,583.55 Horizontal Analysis a) Ustas spreadsheet, prepare a horizontal analysis of the balance sheet. Calculate the increase or decrease in each account from the previous year, in both $ and %. b) Using a spreadsheet, prepare a horizontal analysis of the income statement. Calculate the increase or decrease in each account from the previous year, in both $ and %. Vertical Analysis a) using prepare a vertical analysis of this year's balance sheet and the previous year's balance sheet. Calculate component % for each B/S account, compute as a % of total assets. b) Using a spreadsheet, prepare a vertical analysis of this year's income statement and the previous year's income statement. Calculate component % for each I/S account, compute as a % of net sales
Step by Step Solution
There are 3 Steps involved in it

Get step-by-step solutions from verified subject matter experts