

Question: 6. 7. 8. Hint(s) Check My Work (1 remaining) The U.S. Department of Energy's Fuel Economy Guide provides fuel efficiency data for cars and
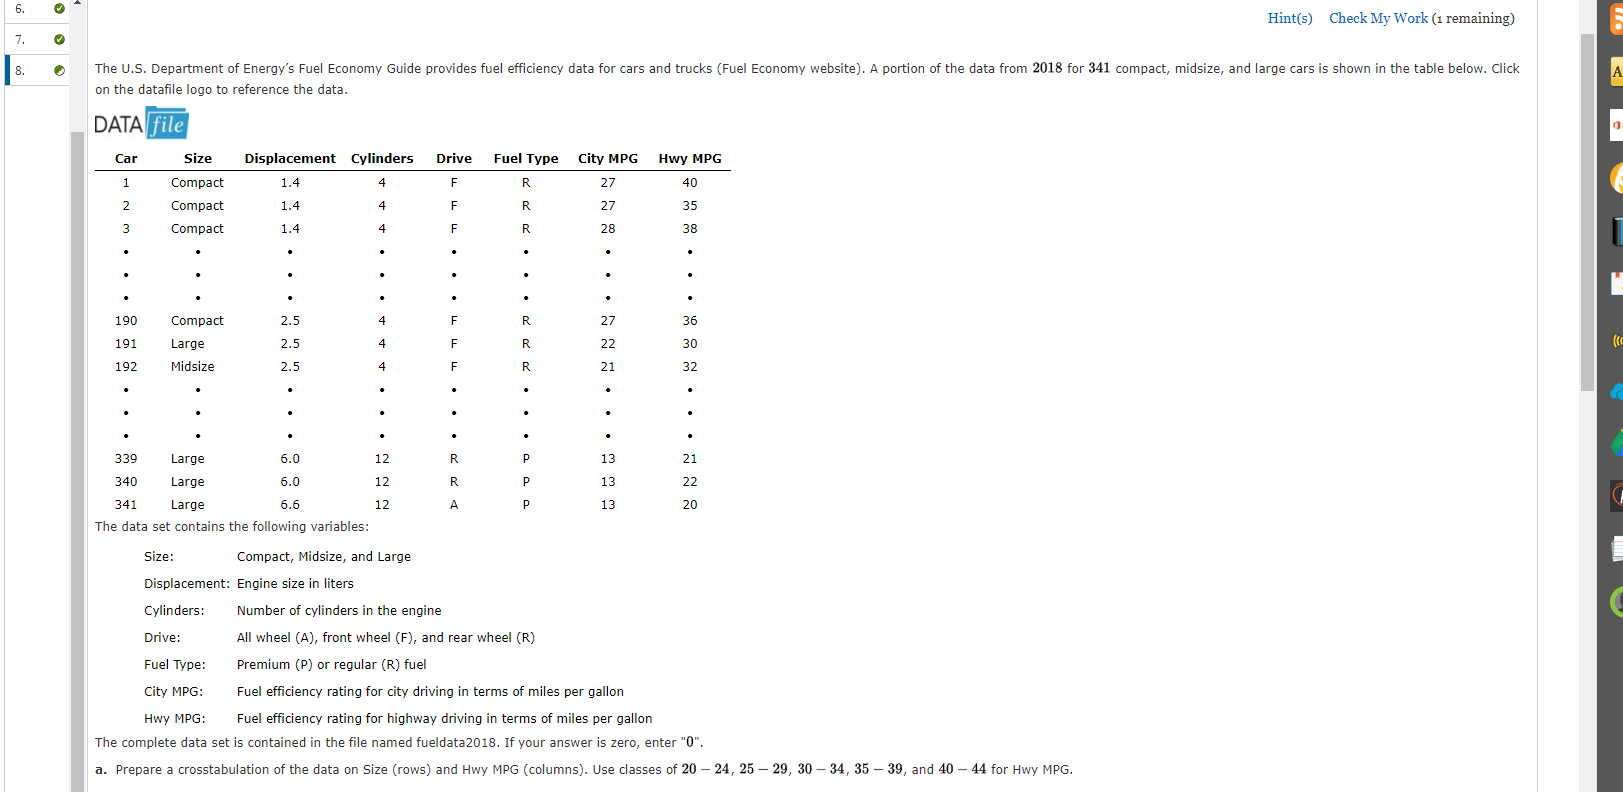
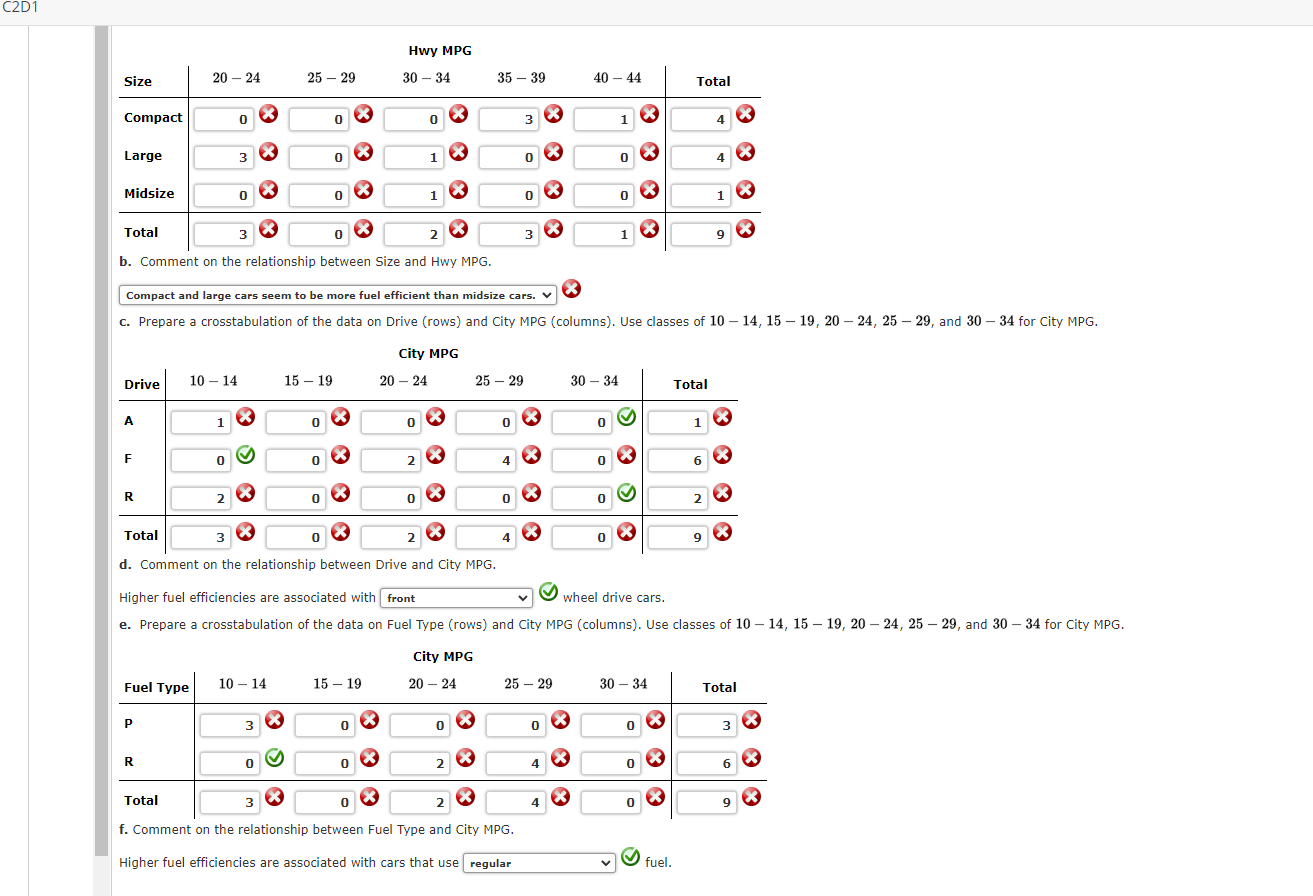


6. 7. 8. Hint(s) Check My Work (1 remaining) The U.S. Department of Energy's Fuel Economy Guide provides fuel efficiency data for cars and trucks (Fuel Economy website). A portion of the data from 2018 for 341 compact, midsize, and large cars is shown in the table below. Click on the datafile logo to reference the data. DATA file Car Size Displacement Cylinders Drive Fuel Type City MPG Hwy MPG 1 Compact 1.4 4 F R 27 40 2 Compact 1.4 4 F R 27 35 3 Compact 1.4 4 F R 28 38 190 Compact 2.5 4 F R 27 36 191 Large 2.5 4 F R 30 192 Midsize 2.5 4 F R 21 32 339 Large 6.0 12 R P 340 Large 6.0 12 R P 341 Large 6.6 12 A P 22.333 13 13 13 12.222 20 The data set contains the following variables: Size: Compact, Midsize, and Large Cylinders: Drive: Fuel Type: Displacement: Engine size in liters Number of cylinders in the engine All wheel (A), front wheel (F), and rear wheel (R) Premium (P) or regular (R) fuel City MPG: Hwy MPG: Fuel efficiency rating for city driving in terms of miles per gallon Fuel efficiency rating for highway driving in terms of miles per gallon The complete data set is contained in the file named fueldata 2018. If your answer is zero, enter "0". a. Prepare a crosstabulation of the data on Size (rows) and Hwy MPG (columns). Use classes of 20-24, 25-29, 30-34, 35-39, and 40-44 for Hwy MPG. A 0 ( C2D1 Size 20-24 25-29 Compact 0 0 Large 3 0 Midsize 0 Total 0 3 * * Hwy MPG 30-34 0 1 1 2 * * * * 35-39 40-44 Total 3 0 0 3 * * 1 4 0 1 4 9 * * b. Comment on the relationship between Size and Hwy MPG. Compact and large cars seem to be more fuel efficient than midsize cars. c. Prepare a crosstabulation of the data on Drive (rows) and City MPG (columns). Use classes of 10-14, 15-19, 20-24, 25-29, and 30 - 34 for City MPG. City MPG Drive 10-14 A 1 F R 2 > 15-19 0 0 0 * * 20-24 0 2 0 25-29 30-34 0 0 0 Total 3 0 2 4 d. Comment on the relationship between Drive and City MPG. 0 0 0 Total 1 6 2 9 Higher fuel efficiencies are associated with front wheel drive cars. e. Prepare a crosstabulation of the data on Fuel Type (rows) and City MPG (columns). Use classes of 10-14, 15-19, 20-24, 25-29, and 30 - 34 for City MPG. Fuel Type 10-14 15-19 City MPG 20-24 25-29 30-34 Total P 3 0 0 0 3 R 0 Total 3 2 2 f. Comment on the relationship between Fuel Type and City MPG. Higher fuel efficiencies are associated with cars that use regular 0 6 4 0 9 fuel. 6. 7. 8. Hint(s) Check My Work (1 remaining) The U.S. Department of Energy's Fuel Economy Guide provides fuel efficiency data for cars and trucks (Fuel Economy website). A portion of the data from 2018 for 341 compact, midsize, and large cars is shown in the table below. Click on the datafile logo to reference the data. DATA file Car Size Displacement Cylinders Drive Fuel Type City MPG Hwy MPG 1 Compact 1.4 4 F R 27 40 2 Compact 1.4 4 F R 27 35 3 Compact 1.4 4 F R 28 38 190 Compact 2.5 4 F R 27 36 191 Large 2.5 4 F R 30 192 Midsize 2.5 4 F R 21 32 339 Large 6.0 12 R P 340 Large 6.0 12 R P 341 Large 6.6 12 A P 22.333 13 13 13 12.222 20 The data set contains the following variables: Size: Compact, Midsize, and Large Cylinders: Drive: Fuel Type: Displacement: Engine size in liters Number of cylinders in the engine All wheel (A), front wheel (F), and rear wheel (R) Premium (P) or regular (R) fuel City MPG: Hwy MPG: Fuel efficiency rating for city driving in terms of miles per gallon Fuel efficiency rating for highway driving in terms of miles per gallon The complete data set is contained in the file named fueldata 2018. If your answer is zero, enter "0". a. Prepare a crosstabulation of the data on Size (rows) and Hwy MPG (columns). Use classes of 20-24, 25-29, 30-34, 35-39, and 40-44 for Hwy MPG. A 0 ( C2D1 Size 20-24 25-29 Compact 0 0 Large 3 0 Midsize 0 Total 0 3 * * Hwy MPG 30-34 0 1 1 2 * * * * 35-39 40-44 Total 3 0 0 3 * * 1 4 0 1 4 9 * * b. Comment on the relationship between Size and Hwy MPG. Compact and large cars seem to be more fuel efficient than midsize cars. c. Prepare a crosstabulation of the data on Drive (rows) and City MPG (columns). Use classes of 10-14, 15-19, 20-24, 25-29, and 30 - 34 for City MPG. City MPG Drive 10-14 A 1 F R 2 > 15-19 0 0 0 * * 20-24 0 2 0 25-29 30-34 0 0 0 Total 3 0 2 4 d. Comment on the relationship between Drive and City MPG. 0 0 0 Total 1 6 2 9 Higher fuel efficiencies are associated with front wheel drive cars. e. Prepare a crosstabulation of the data on Fuel Type (rows) and City MPG (columns). Use classes of 10-14, 15-19, 20-24, 25-29, and 30 - 34 for City MPG. Fuel Type 10-14 15-19 City MPG 20-24 25-29 30-34 Total P 3 0 0 0 3 R 0 Total 3 2 2 f. Comment on the relationship between Fuel Type and City MPG. Higher fuel efficiencies are associated with cars that use regular 0 6 4 0 9 fuel.
Step by Step Solution
There are 3 Steps involved in it
To solve the problem using crosstabulation follow these steps a Crosstabulation of Size and Hwy MPG ... View full answer

Get step-by-step solutions from verified subject matter experts