

Question: Hint(s) Check My Work The following data show the brand, price ($), and the overall score for six stereo headphones that were tested by Consumer
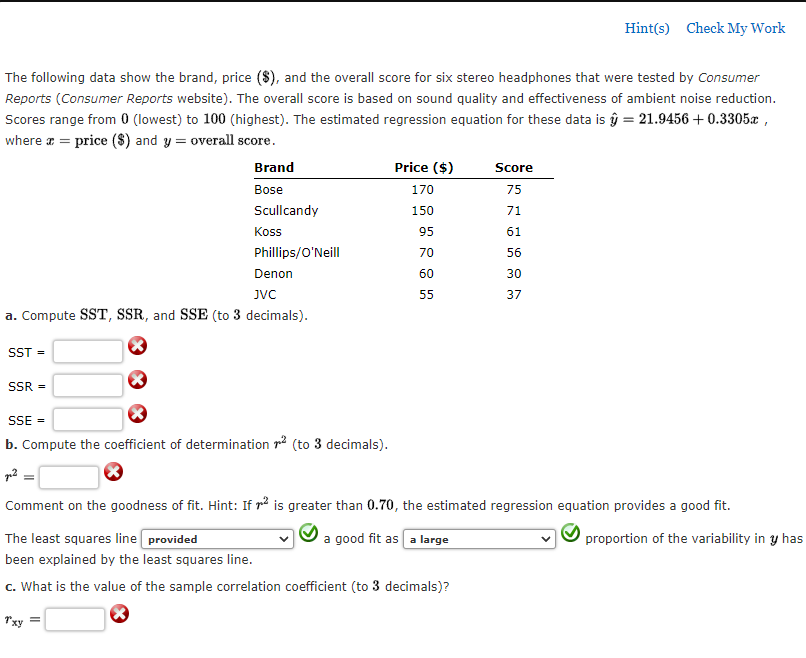

Hint(s) Check My Work The following data show the brand, price ($), and the overall score for six stereo headphones that were tested by Consumer Reports (Consumer Reports website). The overall score is based on sound quality and effectiveness of ambient noise reduction. Scores range from 0 (lowest) to 100 (highest). The estimated regression equation for these data is y = 21.9456 + 0.3305x, where a = price ($) and y = overall score. Brand Price ($) Score Bose 170 75 Scullcandy 150 71 Koss 95 61 Phillips/O'Neill 70 56 Denon 60 30 JVC 55 37 a. Compute SST, SSR, and SSE (to 3 decimals). SST = x SSR = SSE = b. Compute the coefficient of determination 2 (to 3 decimals). 12 = Comment on the goodness of fit. Hint: If r is greater than 0.70, the estimated regression equation provides a good fit. The least squares line |provided a good fit as |a large proportion of the variability in y has been explained by the least squares line. c. What is the value of the sample correlation coefficient (to 3 decimals)? Txy
Step by Step Solution
There are 3 Steps involved in it

Get step-by-step solutions from verified subject matter experts