

Question: Hiring Risky Workers-Spreadsheet Example In this example, bed workers are detected after ONE period Base Discount Raten 0 Quit Rate (0) 0 Firing Cout- Safe
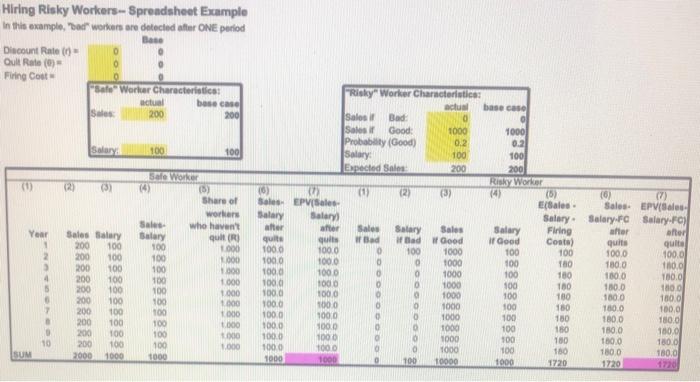


Hiring Risky Workers-Spreadsheet Example In this example, "bed" workers are detected after ONE period Base Discount Raten 0 Quit Rate (0) 0 Firing Cout- Safe Worlar Characteristics beseca 200 200 actual Salary 100 100 TOO (1) (2) (3) Year 1 2 3 4 5 1000 Sales Salary 200 100 200 100 200 100 200 100 200 100 200 100 200 100 200 100 200 100 200 100 2000 1000 "Risky Worker Characteristics actual baseca Sales Bad: 0 Solosir Good 1000 1000 Probability (Good) 0.2 0.2 Salary 100 Expected San 200 200 Risky Worker (6) (2) (3) 14) (5) Sol EPS E/Sales Salary Salary Salary after ar Sales Salary Sales Salary Firing quite quis Bad Bad if Good If Good Costa) 1000 100.0 0 100 1000 100 100 1000 1000 0 1000 100 180 1000 1000 0 1000 100 180 1000 todo 0 0 1000 100 180 100.0 1000 1000 100 180 1000 1000 0 1000 100 180 100.0 1000 0 1000 100 180 100.0 1000 1000 100 180 1000 1000 1000 100 180 1000 1000 0 1000 100 180 1000 1000 0 100 10000 1000 1720 She Worker (9 (5) Share of workers Sale who haven't Salary qull(R 100 1000 100 1000 100 1800 100 1000 100 1000 100 1000 100 1000 100 100 1000 100 1000 1000 (6) (7) Sales EPV/S. Salary.FC Salary FC) after after quite quite 1000 1800 10.0 100.0 180.0 180.0 100.0 1800 180.0 180.0 1000 180.0 180.0 150.0 180.0 180.0 180.0 1800 1800 1220 7 000 . 10 SUM Please download the Excel "Playground for Hiring" from Canvas. What is the Expected Present Value (EPV) of the risky worker if discount rate is 0.1. All other parameters are same as the base case. Please download the Excel "Playground for Hiring" from Canvas. What is the Expected Present Value (EPV) of the risky worker if probability of good is 0.5. All other parameters are same as the base case. Hiring Risky Workers-Spreadsheet Example In this example, "bed" workers are detected after ONE period Base Discount Raten 0 Quit Rate (0) 0 Firing Cout- Safe Worlar Characteristics beseca 200 200 actual Salary 100 100 TOO (1) (2) (3) Year 1 2 3 4 5 1000 Sales Salary 200 100 200 100 200 100 200 100 200 100 200 100 200 100 200 100 200 100 200 100 2000 1000 "Risky Worker Characteristics actual baseca Sales Bad: 0 Solosir Good 1000 1000 Probability (Good) 0.2 0.2 Salary 100 Expected San 200 200 Risky Worker (6) (2) (3) 14) (5) Sol EPS E/Sales Salary Salary Salary after ar Sales Salary Sales Salary Firing quite quis Bad Bad if Good If Good Costa) 1000 100.0 0 100 1000 100 100 1000 1000 0 1000 100 180 1000 1000 0 1000 100 180 1000 todo 0 0 1000 100 180 100.0 1000 1000 100 180 1000 1000 0 1000 100 180 100.0 1000 0 1000 100 180 100.0 1000 1000 100 180 1000 1000 1000 100 180 1000 1000 0 1000 100 180 1000 1000 0 100 10000 1000 1720 She Worker (9 (5) Share of workers Sale who haven't Salary qull(R 100 1000 100 1000 100 1800 100 1000 100 1000 100 1000 100 1000 100 100 1000 100 1000 1000 (6) (7) Sales EPV/S. Salary.FC Salary FC) after after quite quite 1000 1800 10.0 100.0 180.0 180.0 100.0 1800 180.0 180.0 1000 180.0 180.0 150.0 180.0 180.0 180.0 1800 1800 1220 7 000 . 10 SUM Please download the Excel "Playground for Hiring" from Canvas. What is the Expected Present Value (EPV) of the risky worker if discount rate is 0.1. All other parameters are same as the base case. Please download the Excel "Playground for Hiring" from Canvas. What is the Expected Present Value (EPV) of the risky worker if probability of good is 0.5. All other parameters are same as the base case
Step by Step Solution
There are 3 Steps involved in it

Get step-by-step solutions from verified subject matter experts