

Question: Histogram (response is srsror.) For the plots above regarding a regression of systolic blood pressure on number of years since migration, are all the assumptions
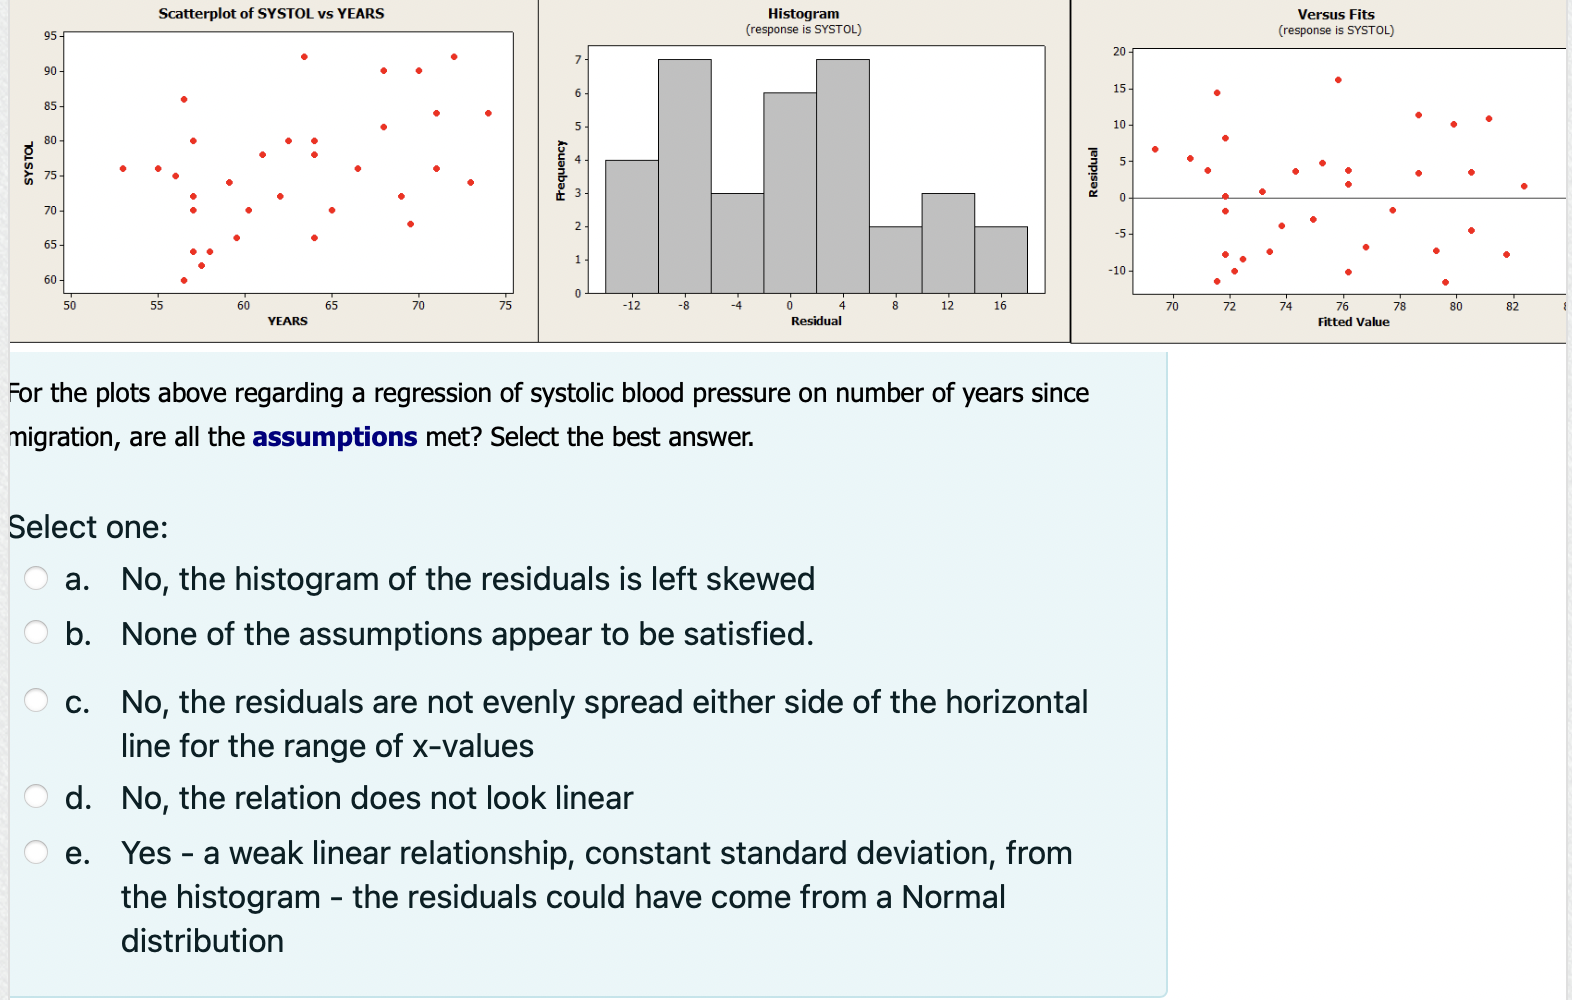
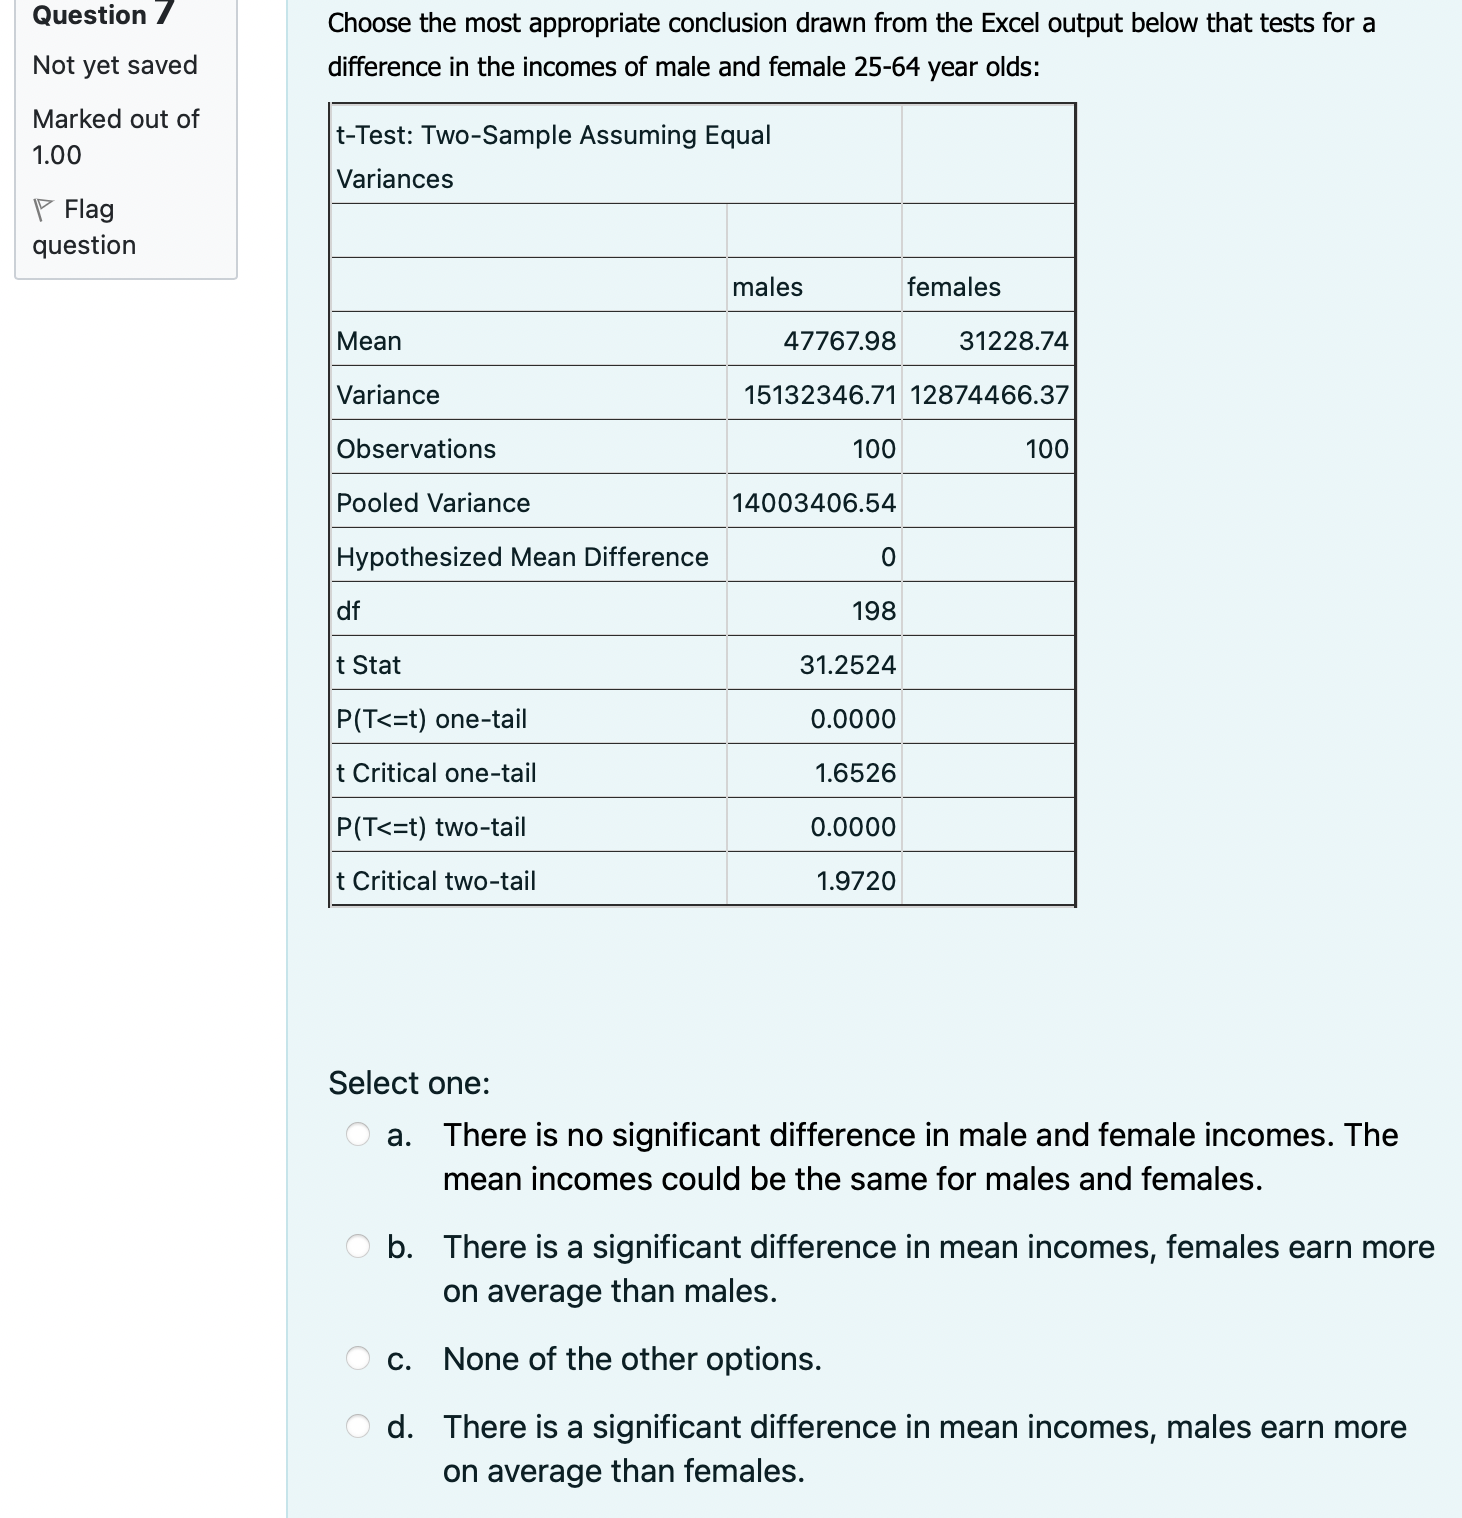
Histogram (response is srsror.) For the plots above regarding a regression of systolic blood pressure on number of years since migration, are all the assumptions met? Select the best answer. Select one: h a. No, the histogram of the residuals is left skewed \"5- b. None of the assumptions appear to be satisfied. /'\\ ' ,- c. No, the residuals are not evenly spread either side of the horizontal line for the range of xvalues ft- d. No, the relation does not look linear " e. Yes - a weak linear relationship, constant standard deviation, from the histogram the residuals could have come from a Normal distribution Question 7 Choose the most appropriate conclusion drawn from the Excel output below that tests for a Not yet saved difference in the incomes of male and female 25-64 year olds: Marked OUt 0f t-Test: Two-Sample Assuming Equal 1'00 Variances 17 Flag question males females Mean 47767.98 31228.74 Variance 1513234671 1287446637 Observations 100 100 Pooled Variance 1400340654 Hypothesized Mean Difference 0 df 198 t Stat 31.2524 P(T
Step by Step Solution
There are 3 Steps involved in it

Get step-by-step solutions from verified subject matter experts