

Question: Histograms and Distribution Functions Consider This: A statistics class surveyed 218 motorized vehicles in the parking lot of a mall, counting the number of vehicles.
Histograms and Distribution Functions
Consider This:
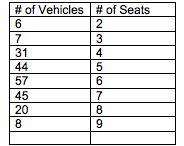
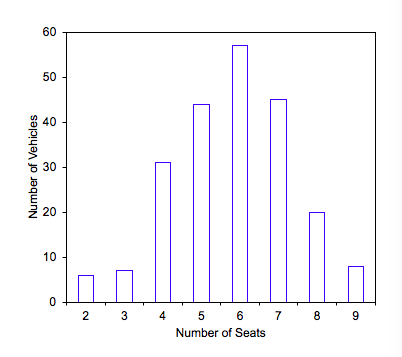
A statistics class surveyed 218 motorized vehicles in the parking lot of a mall, counting the number of vehicles. Cars are classified by the number of passenger seats they have. The number of vehicles in that class is the count or frequency of that class.
Here is the raw data:
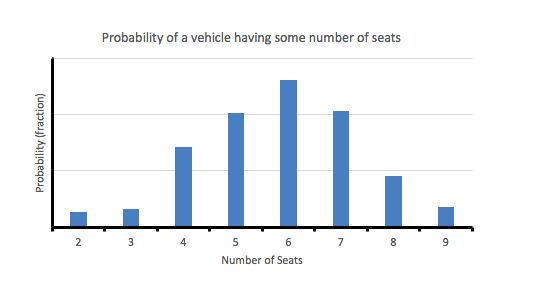
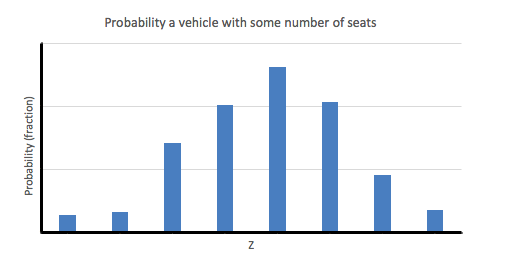
\f\fProbability of a vehicle having some number of seats Probability (fraction) 2 LLI 3 4 5 6 7 8 9 Number of Seats\f\f\f
Step by Step Solution
There are 3 Steps involved in it
1 Expert Approved Answer
Step: 1 Unlock

Question Has Been Solved by an Expert!
Get step-by-step solutions from verified subject matter experts
Step: 2 Unlock
Step: 3 Unlock