

Question: Histograms or bar charts are an effective method to represent collected numerical data graphically, and yet it is such a simple method to allow visual
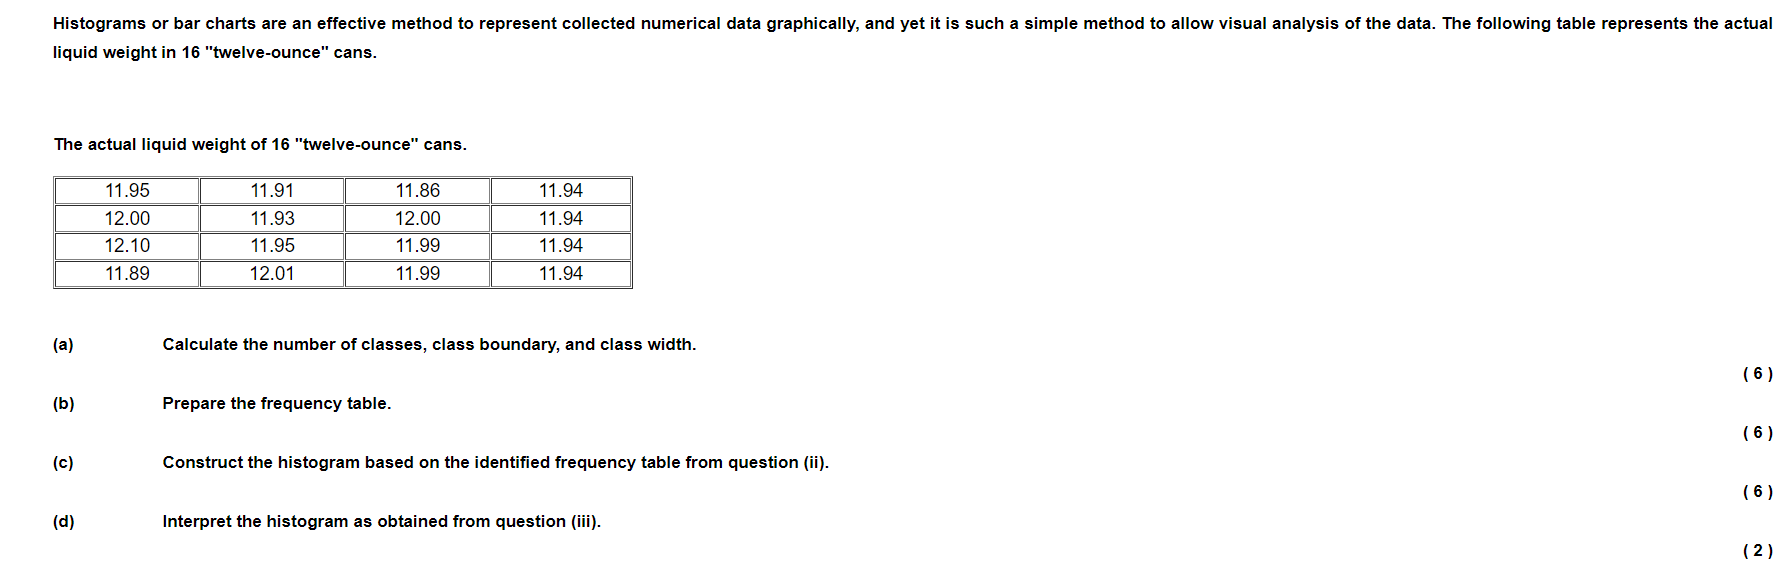
Histograms or bar charts are an effective method to represent collected numerical data graphically, and yet it is such a simple method to allow visual analysis of the data. The following table represents the actual liquid weight in 16 "twelve-ounce" cans. The actual liquid weight of 16 "twelve-ounce" cans. 11.95 11.91 11.86 11.94 12.00 11.93 12.00 11.94 12.10 11.95 11.99 11.94 11.89 12.01 11.99 11.94 (a) M (Cl (d) Calculate the number of classes, class boundary, and class width. Prepare the frequency table. Construct the histogram based on the identied frequency table lrorn question (ii). Interpret the histogram as obtained from question (iii). (5) (5) (5) (2)
Step by Step Solution
There are 3 Steps involved in it

Get step-by-step solutions from verified subject matter experts