

Question: HISTORICAL FINANCIAL STATEMENTS General Comments: - It is very important to start with i) Up-To-Date. ii) Normalized. and iii) Cleansed data. - Beware of
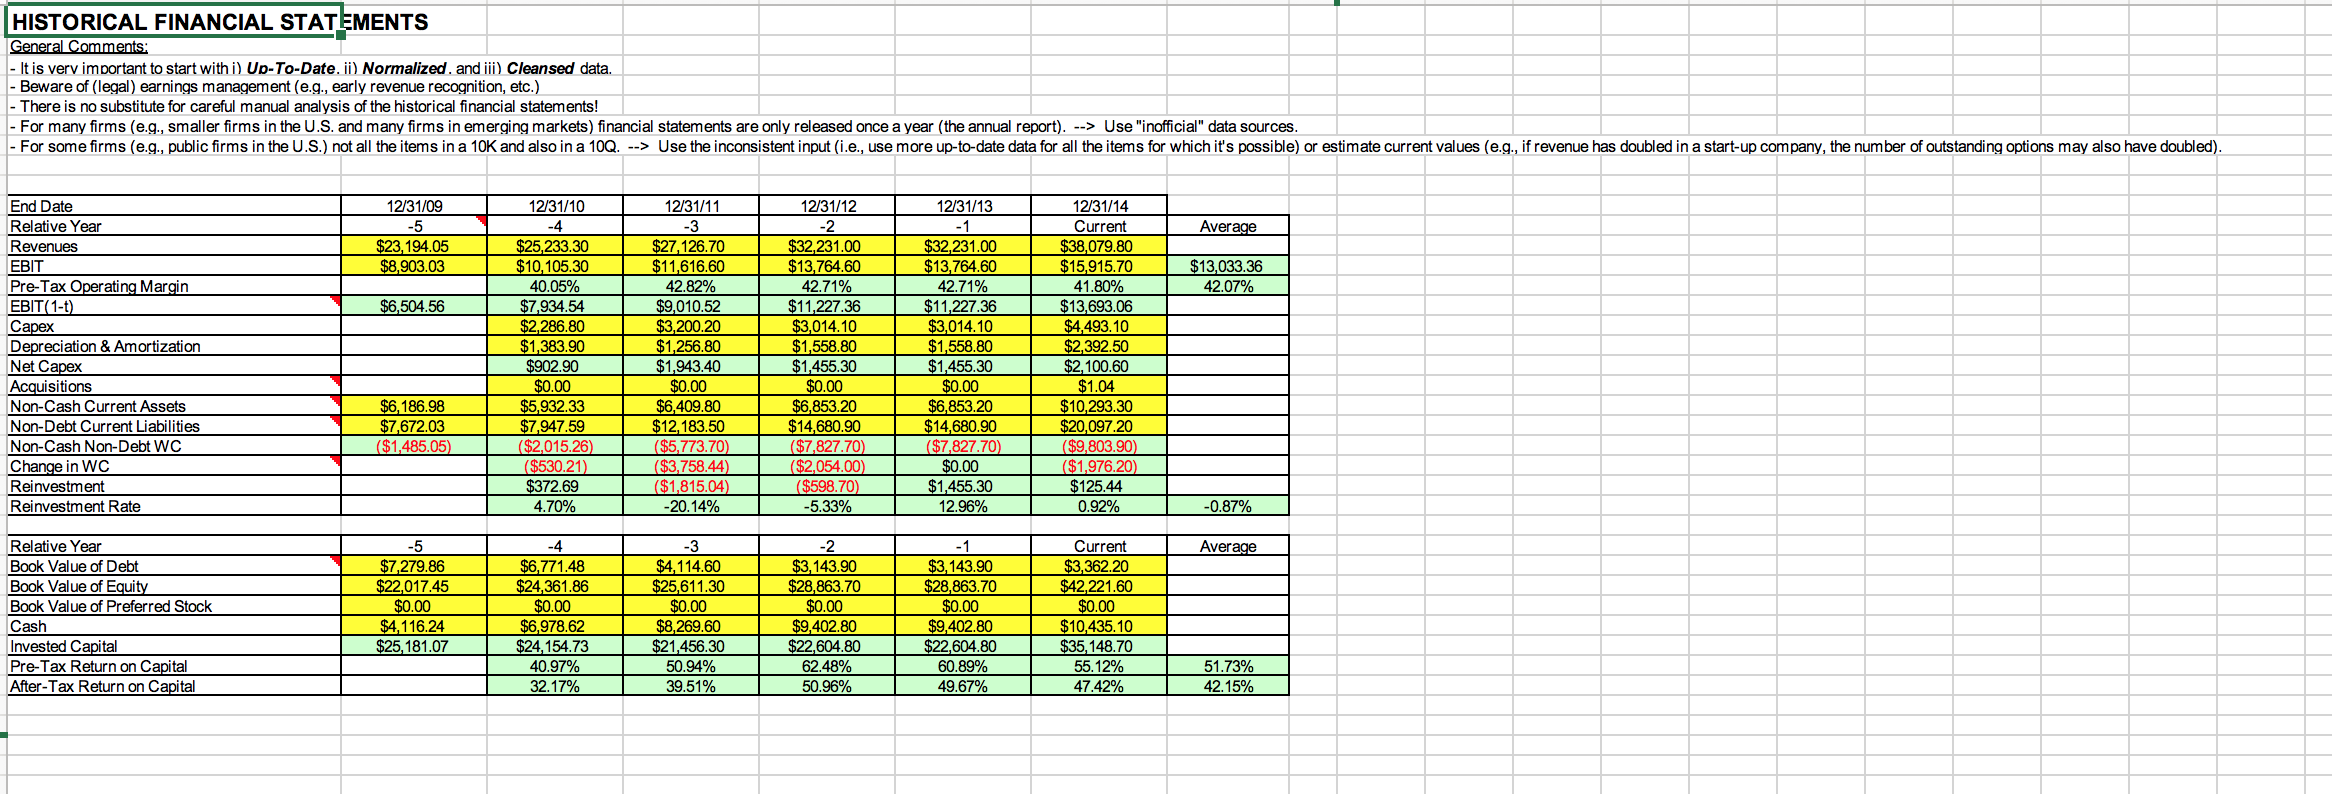
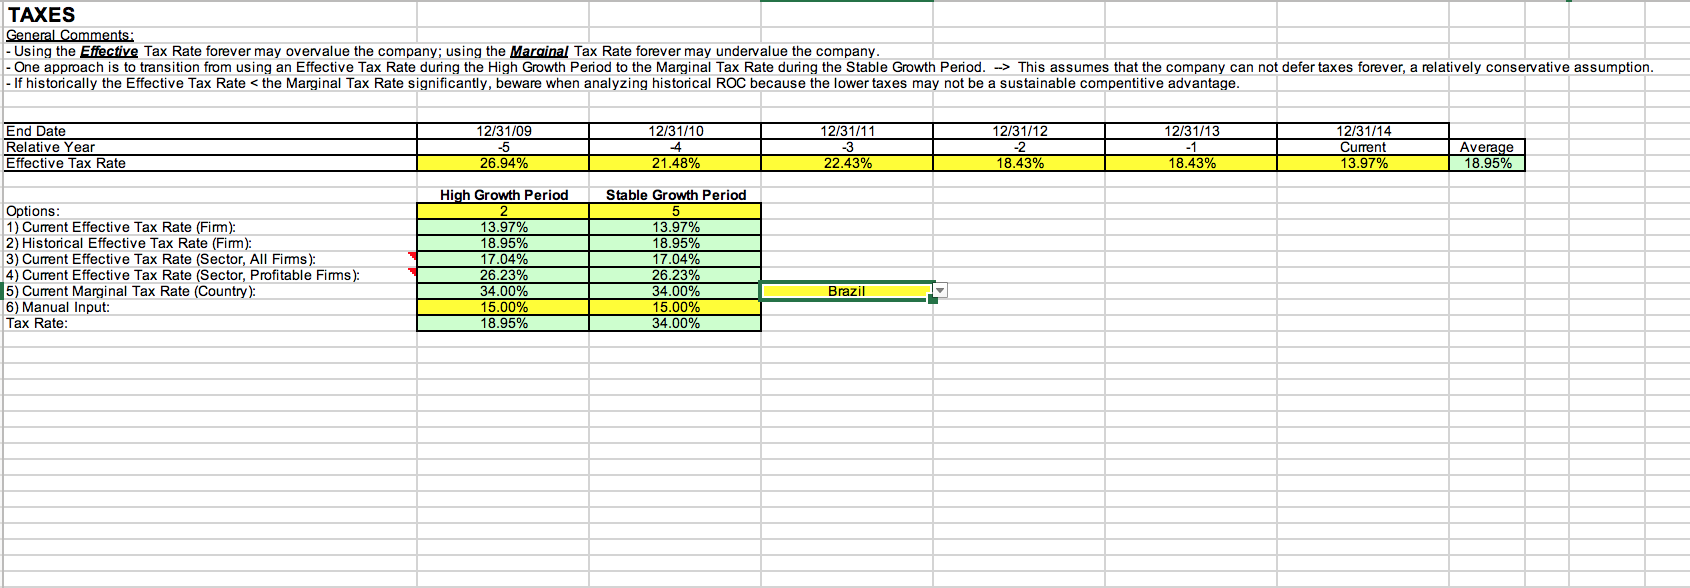
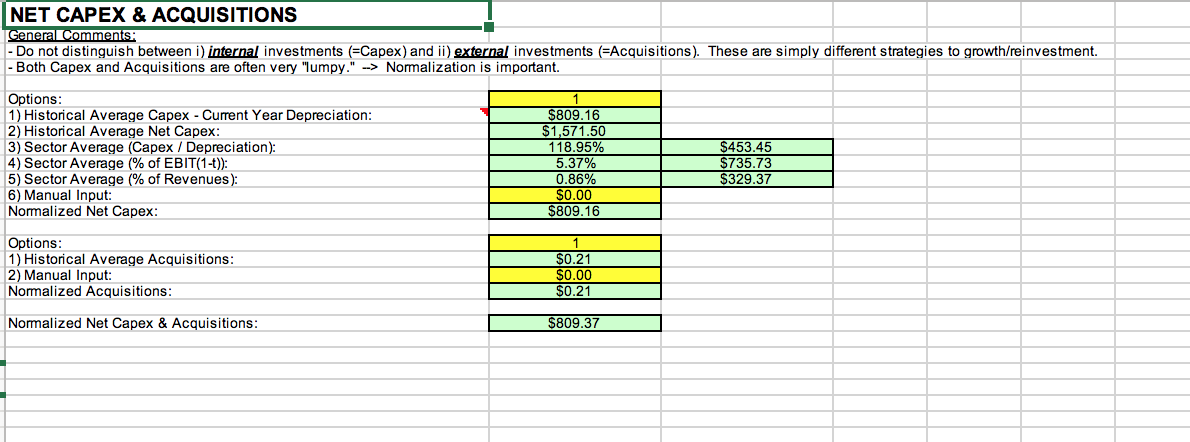
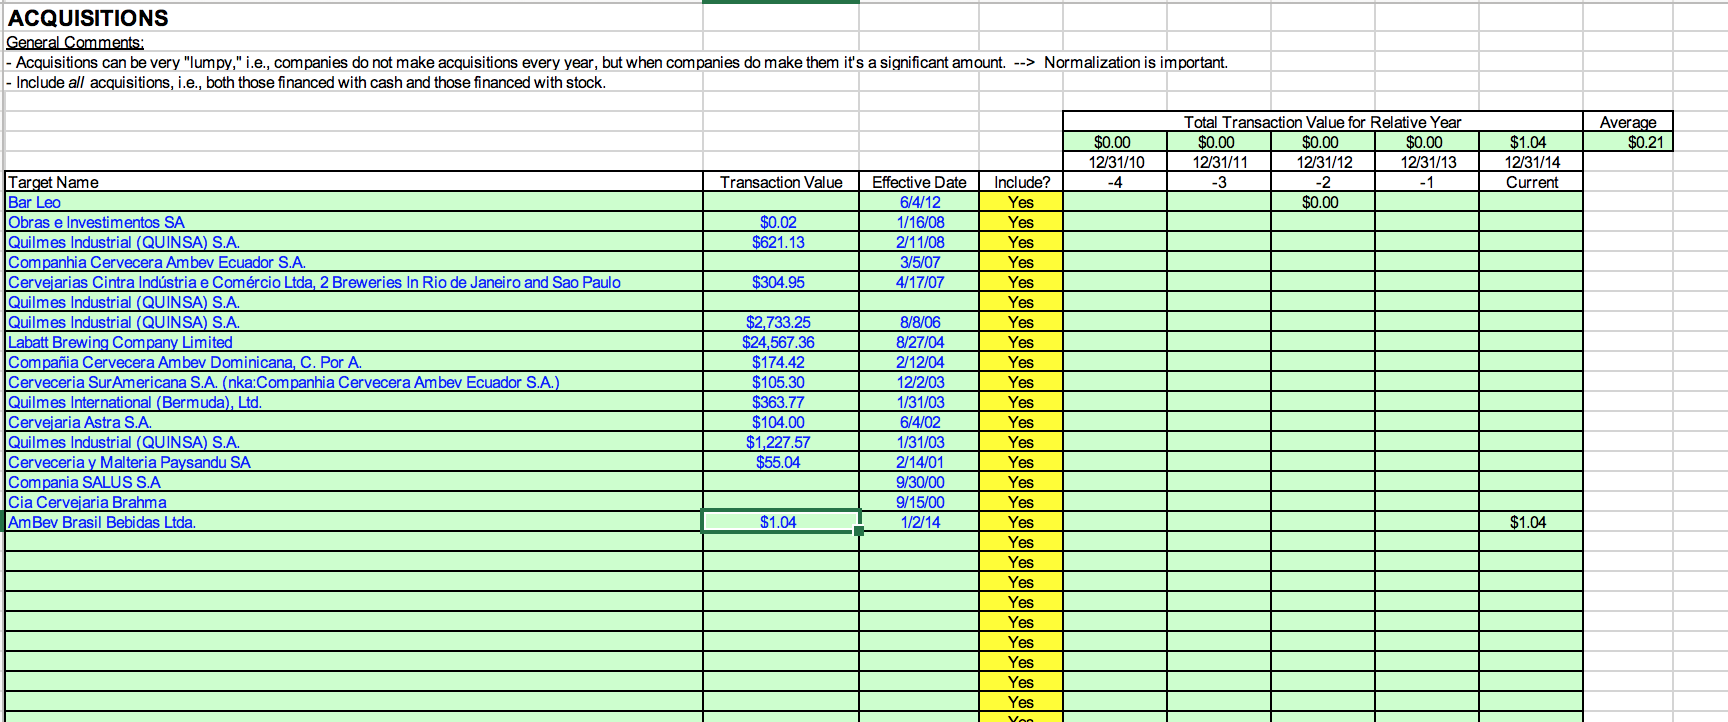
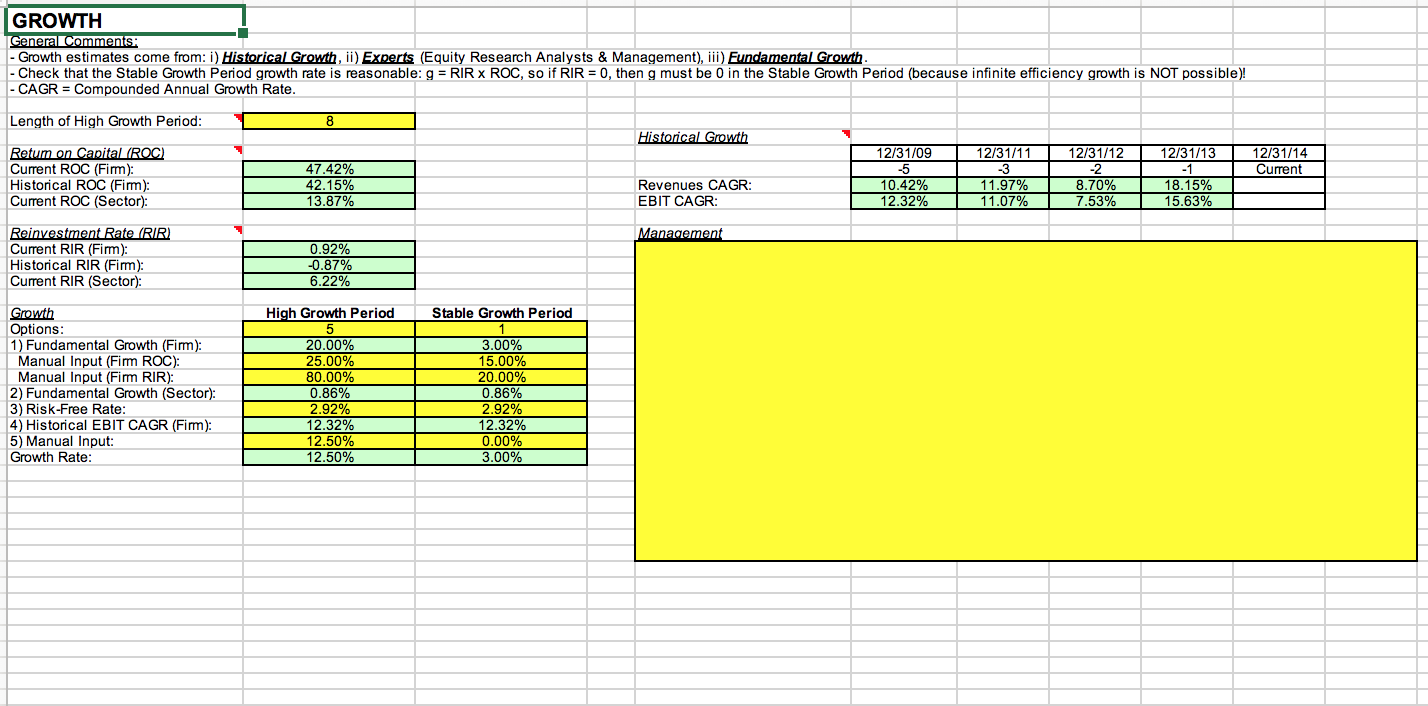
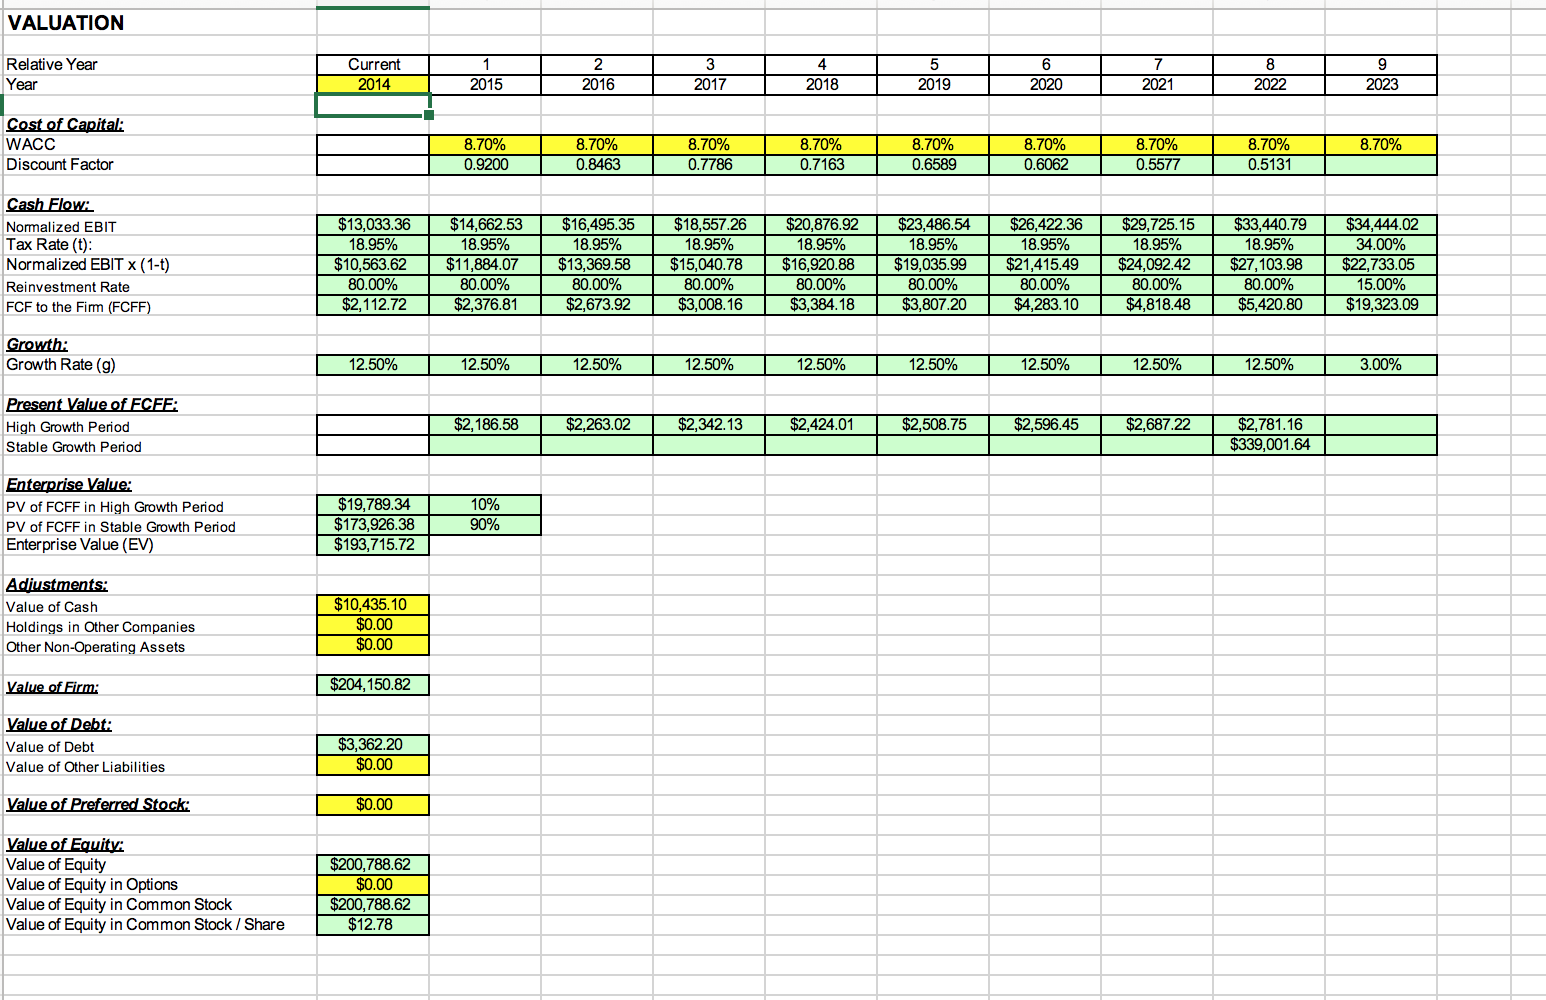
HISTORICAL FINANCIAL STATEMENTS General Comments: - It is very important to start with i) Up-To-Date. ii) Normalized. and iii) Cleansed data. - Beware of (legal) earnings management (e.g., early revenue recognition, etc.) - There is no substitute for careful manual analysis of the historical financial statements! - For many firms (e.g., smaller firms in the U.S. and many firms in emerging markets) financial statements are only released once a year (the annual report). --> Use "inofficial" data sources. - For some firms (e.g., public firms in the U.S.) not all the items in a 10K and also in a 10Q. --> Use the inconsistent input (i.e., use more up-to-date data for all the items for which it's possible) or estimate current values (e.g., if revenue has doubled in a start-up company, the number of outstanding options may also have doubled). End Date Relative Year 12/31/09 -5 Revenues $23,194.05 12/31/10 -4 $25,233.30 12/31/11 -3 12/31/12 12/31/13 EBIT $8,903.03 $10,105.30 $27,126.70 $11,616.60 -2 $32,231.00 $13,764.60 Pre-Tax Operating Margin 40.05% EBIT(1-t) $6,504.56 $7,934.54 42.82% $9,010.52 42.71% $11,227.36 -1 $32,231.00 $13,764.60 42.71% $11,227.36 12/31/14 Current $38,079.80 $15,915.70 41.80% $13,693.06 Average $13,033.36 42.07% Capex $2,286.80 $3,200.20 $3,014.10 $3,014.10 $4,493.10 Depreciation & Amortization $1,383.90 $1,256.80 $1,558.80 $1,558.80 $2,392.50 Net Capex $902.90 $1,943.40 $1,455.30 $1,455.30 $2,100.60 Acquisitions $0.00 $0.00 $0.00 Non-Cash Current Assets $6.186.98 $5,932.33 $6,409.80 $6,853.20 $0.00 $6,853.20 $1.04 $10,293.30 Non-Debt Current Liabilities $7,672.03 $7,947.59 $12,183.50 $14,680.90 $14,680.90 $20,097.20 Non-Cash Non-Debt WC ($1,485.05) ($2,015.26) ($5,773.70) ($7,827.70) ($7,827.70) ($9,803.90) Change in WC ($530.21) ($3,758.44) ($2,054.00) Reinvestment Reinvestment Rate $372.69 4.70% ($1,815.04) -20.14% ($598.70) -5.33% $0.00 $1,455.30 12.96% ($1,976.20) $125.44 0.92% -0.87% Relative Year Book Value of Debt -5 $7,279.86 -4 $6.771.48 Book Value of Equity $22,017.45 $24,361.86 Book Value of Preferred Stock $0.00 Cash $4,116.24 $0.00 $6,978.62 -3 $4,114.60 $25,611.30 $0.00 $8,269.60 -2 $3,143.90 $28,863.70 $0.00 $9,402.80 -1 $3,143.90 $28,863.70 $0.00 $9,402.80 Invested Capital $25,181.07 $24,154.73 $21,456.30 $22,604.80 $22,604.80 Current $3,362.20 $42,221.60 $0.00 $10,435.10 $35,148.70 Average Pre-Tax Return on Capital 40.97% 50.94% 62.48% 60.89% 55.12% 51.73% After-Tax Return on Capital 32.17% 39.51% 50.96% 49.67% 47.42% 42.15% TAXES General Comments: - Using the Effective Tax Rate forever may overvalue the company; using the Marginal Tax Rate forever may undervalue the company. - One approach is to transition from using an Effective Tax Rate during the High Growth Period to the Marginal Tax Rate during the Stable Growth Period. --> This assumes that the company can not defer taxes forever, a relatively conservative assumption. - If historically the Effective Tax Rate < the Marginal Tax Rate significantly, beware when analyzing historical ROC because the lower taxes may not be a sustainable compentitive advantage. End Date Relative Year Effective Tax Rate 12/31/09 -5 26.94% 12/31/10 -4 12/31/11 -3 21.48% 22.43% High Growth Period Stable Growth Period Options: 2 5 1) Current Effective Tax Rate (Firm): 13.97% 13.97% 2) Historical Effective Tax Rate (Firm): 18.95% 18.95% 3) Current Effective Tax Rate (Sector, All Firms): 17.04% 17.04% 4) Current Effective Tax Rate (Sector, Profitable Firms): 26.23% 26.23% 5) Current Marginal Tax Rate (Country): 34.00% 34.00% Brazil 6) Manual Input: 15.00% 15.00% Tax Rate: 18.95% 34.00% 12/31/12 -2 18.43% 12/31/13 12/31/14 -1 Current Average 18.43% 13.97% 18.95% NET CAPEX & ACQUISITIONS General Comments: -Do not distinguish between i) internal investments (=Capex) and ii) external investments (=Acquisitions). These are simply different strategies to growth/reinvestment. |- Both Capex and Acquisitions are often very "lumpy." --> Normalization is important. Options: 1) Historical Average Capex - Current Year Depreciation: 2) Historical Average Net Capex: 3) Sector Average (Capex/ Depreciation): 4) Sector Average (% of EBIT(1-t)): 5) Sector Average (% of Revenues): 6) Manual Input: Normalized Net Capex: Options: 1) Historical Average Acquisitions: 2) Manual Input: Normalized Acquisitions: Normalized Net Capex & Acquisitions: $809.16 $1,571.50 118.95% $453.45 5.37% $735.73 0.86% $329.37 $0.00 $809.16 1 $0.21 $0.00 $0.21 $809.37 ACQUISITIONS General Comments: - Acquisitions can be very "lumpy," i.e., companies do not make acquisitions every year, but when companies do make them it's a significant amount. --> Normalization is important. - Include all acquisitions, i.e., both those financed with cash and those financed with stock. $0.00 12/31/10 Total Transaction Value for Relative Year $0.00 $0.00 12/31/11 Average 12/31/12 Target Name Bar Leo Obras e Investimentos SA Transaction Value Effective Date Include? -4 -3 6/4/12 Yes -2 $0.00 $0.00 12/31/13 -1 $1.04 12/31/14 $0.21 Current $0.02 1/16/08 Yes Quilmes Industrial (QUINSA) S.A. $621.13 2/11/08 Yes Companhia Cervecera Ambev Ecuador S.A. 3/5/07 Yes Cervejarias Cintra Indstria e Comrcio Ltda, 2 Breweries In Rio de Janeiro and Sao Paulo $304.95 4/17/07 Yes Quilmes Industrial (QUINSA) S.A. Yes Quilmes Industrial (QUINSA) S.A. $2,733.25 8/8/06 Yes Labatt Brewing Company Limited $24,567.36 8/27/04 Yes Compaia Cervecera Ambev Dominicana, C. Por A. $174.42 2/12/04 Yes Cerveceria SurAmericana S.A. (nka:Companhia Cervecera Ambev Ecuador S.A.) $105.30 12/2/03 Yes Quilmes International (Bermuda), Ltd. $363.77 1/31/03 Yes Cervejaria Astra S.A. $104.00 6/4/02 Yes Quilmes Industrial (QUINSA) S.A. Cerveceria y Malteria Paysandu SA Compania SALUS S.A Cia Cervejaria Brahma AmBev Brasil Bebidas Ltda. $1,227.57 1/31/03 Yes $55.04 2/14/01 Yes 9/30/00 Yes 9/15/00 Yes $1.04 1/2/14 Yes $1.04 Yes Yes Yes Yes Yes Yes Yes Yes Yes Voo GROWTH General Comments: - Growth estimates come from: i) Historical Growth, ii) Experts (Equity Research Analysts & Management), iii) Fundamental Growth. - Check that the Stable Growth Period growth rate is reasonable: g = RIR X ROC, so if RIR = 0, then g must be 0 in the Stable Growth Period (because infinite efficiency growth is NOT possible)! - CAGR = Compounded Annual Growth Rate. Length of High Growth Period: Retum on Capital (ROC) Current ROC (Firm): Historical ROC (Firm): 8 47.42% 42.15% Current ROC (Sector): 13.87% Reinvestment Rate (RIR) Current RIR (Firm): Historical RIR (Firm): Current RIR (Sector): 0.92% -0.87% 6.22% Growth Options: Manual Input (Firm ROC): High Growth Period Stable Growth Period 5 1 1) Fundamental Growth (Firm): 20.00% 3.00% 25.00% 15.00% Manual Input (Firm RIR): 80.00% 20.00% 2) Fundamental Growth (Sector): 0.86% 0.86% 3) Risk-Free Rate: 2.92% 2.92% 4) Historical EBIT CAGR (Firm): 12.32% 12.32% 5) Manual Input: 12.50% 0.00% Growth Rate: 12.50% 3.00% Historical Growth 12/31/09 -5 12/31/11 -3 12/31/12 -2 12/31/13 12/31/14 -1 Current Revenues CAGR: EBIT CAGR: 10.42% 11.97% 8.70% 18.15% 12.32% 11.07% 7.53% 15.63% Management VALUATION Relative Year Current 1 2 3 4 5 6 8 9 Year 2014 2015 2016 2017 2018 2019 2020 2021 2022 2023 Cost of Capital: WACC Discount Factor 8.70% 0.9200 8.70% 8.70% 8.70% 8.70% 0.8463 0.7786 0.7163 0.6589 8.70% 0.6062 8.70% 0.5577 8.70% 0.5131 8.70% Cash Flow: Normalized EBIT Tax Rate (t): $13,033.36 18.95% Normalized EBIT X (1-t) $10,563.62 $14,662.53 18.95% $11,884.07 Reinvestment Rate FCF to the Firm (FCFF) 80.00% $2,112.72 80.00% $2,376.81 $16,495.35 18.95% $13,369.58 80.00% $2,673.92 $18,557.26 18.95% $15,040.78 80.00% $3,008.16 $20,876.92 18.95% $16,920.88 $23,486.54 18.95% $19,035.99 $26,422.36 18.95% $21,415.49 80.00% $3,384.18 80.00% $3,807.20 80.00% $4,283.10 $29,725.15 18.95% $24,092.42 80.00% $4,818.48 $33,440.79 18.95% $27,103.98 80.00% $5,420.80 $34,444.02 34.00% $22,733.05 15.00% $19,323.09 Growth: Growth Rate (g) 12.50% 12.50% 12.50% 12.50% 12.50% 12.50% 12.50% 12.50% 12.50% 3.00% Present Value of FCFF: High Growth Period Stable Growth Period Enterprise Value: $2,186.58 $2,263.02 $2,342.13 $2,424.01 $2,508.75 $2,596.45 $2,687.22 $2,781.16 $339,001.64 PV of FCFF in High Growth Period $19,789.34 PV of FCFF in Stable Growth Period $173,926.38 10% 90% Enterprise Value (EV) $193,715.72 Adjustments: Value of Cash $10,435.10 Holdings in Other Companies $0.00 Other Non-Operating Assets $0.00 Value of Firm: $204,150.82 Value of Debt: Value of Debt $3,362.20 Value of Other Liabilities $0.00 Value of Preferred Stock: $0.00 Value of Equity: Value of Equity $200,788.62 Value of Equity in Options Value of Equity in Common Stock Value of Equity in Common Stock/Share $0.00 $200,788.62 $12.78
Step by Step Solution
There are 3 Steps involved in it

Get step-by-step solutions from verified subject matter experts