

Question: Historical ratios needed, this is the example of the data needed from Apples financial statements. I'm not sure where to get the numbers from. Any
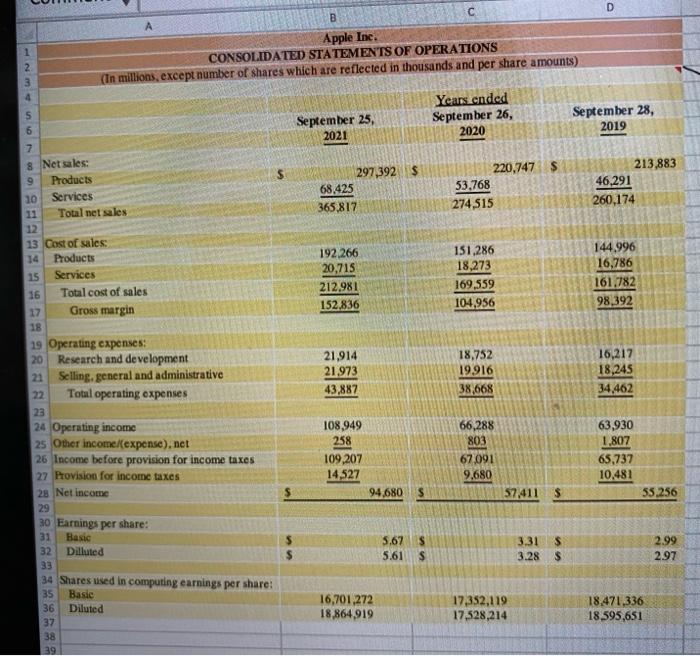
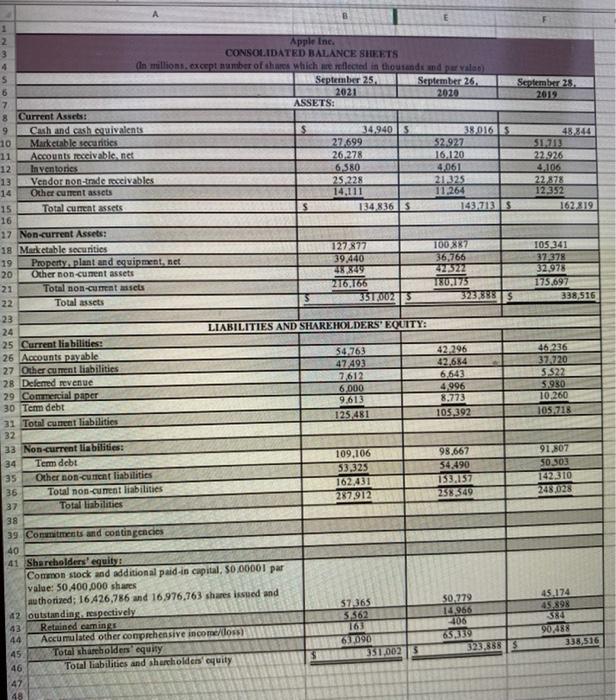
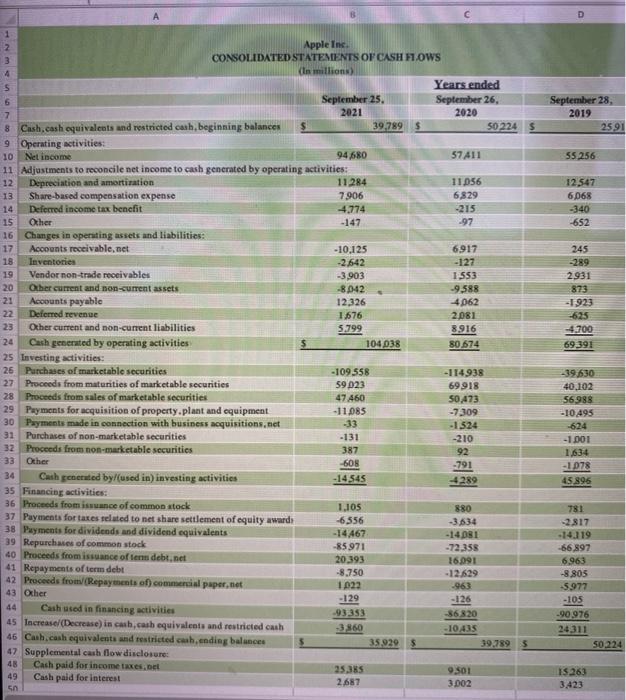
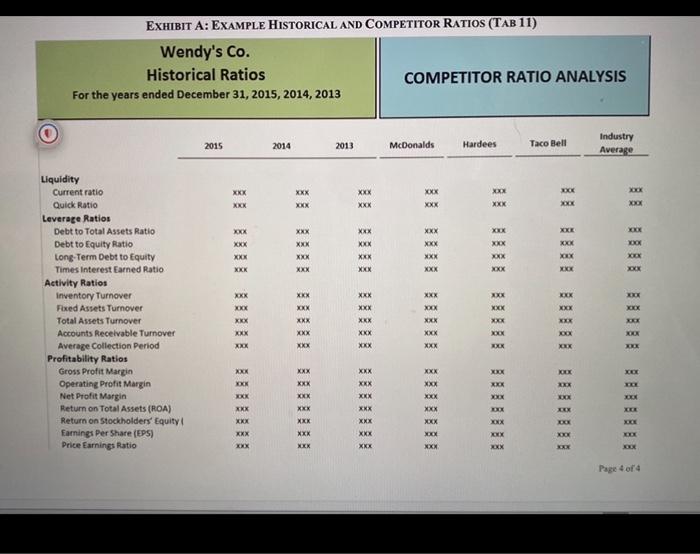
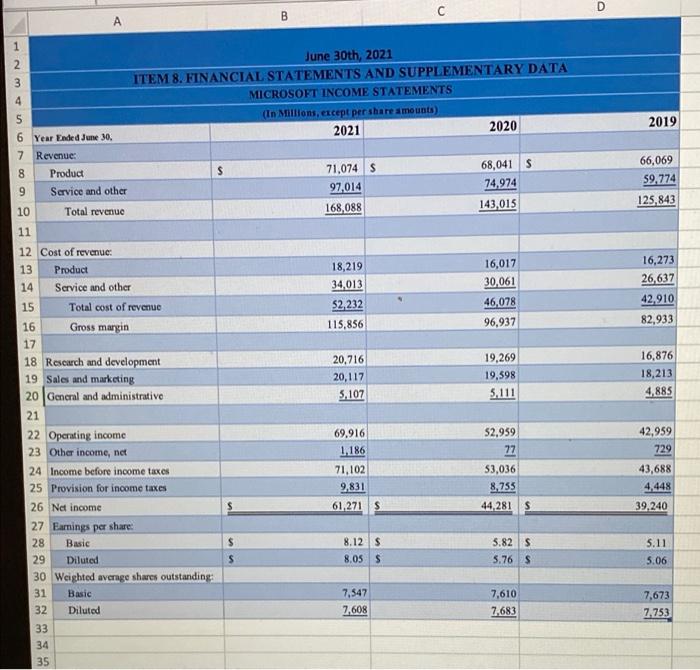
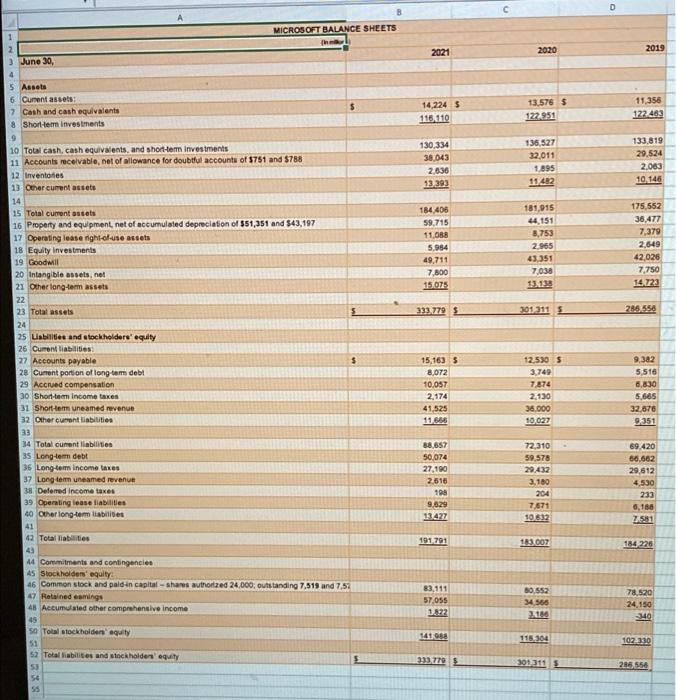
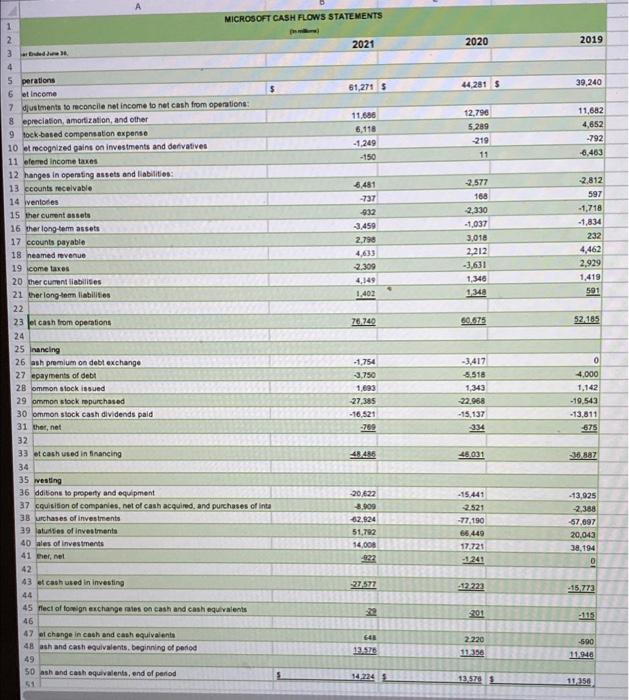
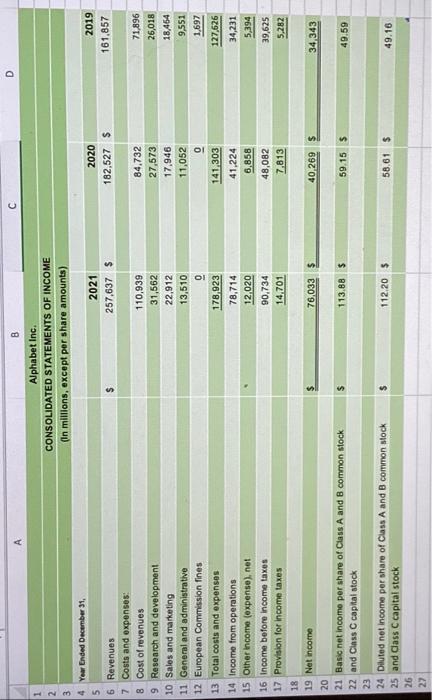
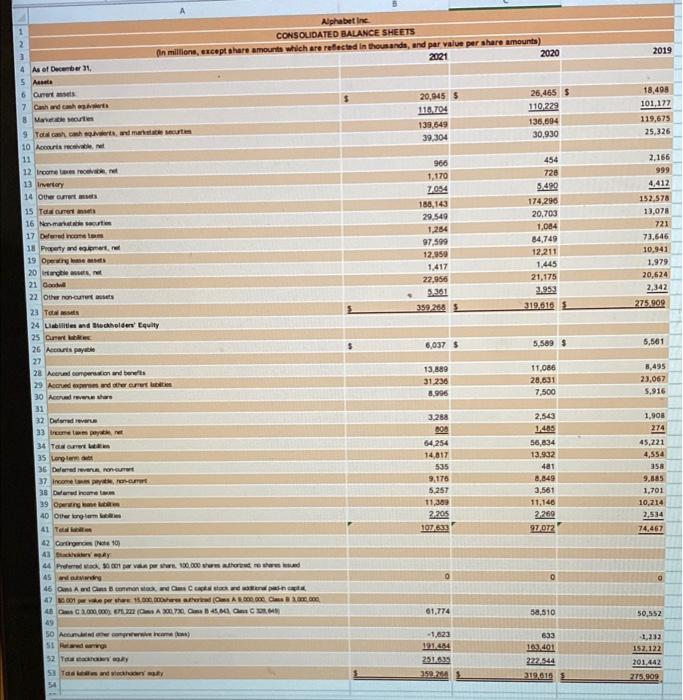
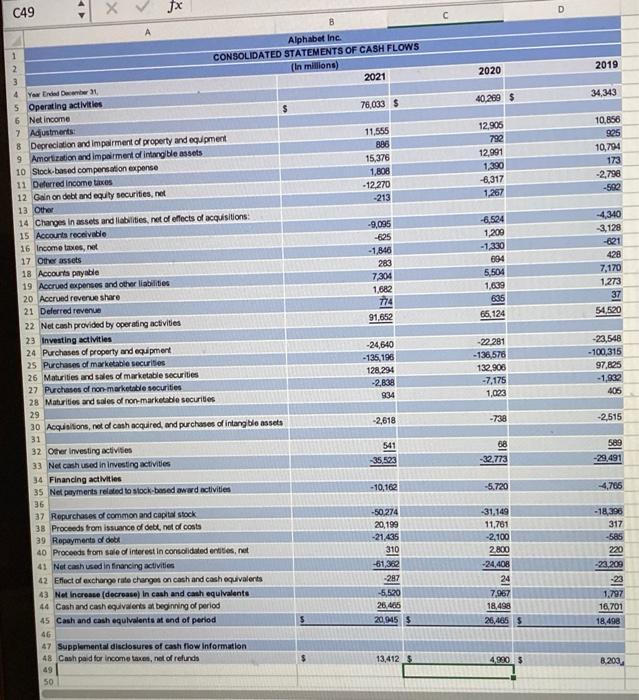
123A 557 D B A Apple Inc. CONSOLIDATED STATEMENTS OF OPERATIONS (In millions, except number of shares which are reflected in thousands and per share amounts) Years ended September 26, September 25, 2021 2020 68,425 53,768 365,817 274,515 192,266 151,286 20,715 18,273 212,981 169,559 152,836 104,956 21,914 18,752 21,973 19.916 43,887 38,668 108,949 66,288 258 803 109,207 67,091 14,527 9,680 8 Net sales: 9 Products 10 Services 11 Total net sales 12 13 Cost of sales: 14 Products 15 Services 16 Total cost of sales 17 Gross margin 18 19 Operating expenses: 20 Research and development 21 Selling, general and administrative 22 Total operating expenses 23 24 Operating income 25 Other income/(expense), net 26 Income before provision for income taxes 27 Provision for income taxes 28 Net income 29 30 Earnings per share: 31 Basic 32 Dilluted 33 34 Shares used in computing earnings per share: 35 Basic 36 Diluted 37 38 39 297,392 $ 94,680 5.67 5.61 16,701,272 18,864,919 S 220,747 $ 57,411 $ 3.31 $ 3.28 $ 17,352,119 17,528,214 September 28, 2019 46,291 260,174 144.996 16,786 161,782 98,392 16,217 18,245 34,462 63,930 1,807 65,737 10,481 213,883 55,256 2.99 2.97 18,471,336 18,595,651 Apple Inc. CONSOLIDATED BALANCE SHEETS In millions, except number of shares which are reflected in thousands and par valas) i September 25, September 26, 2021 2020 ASSETS: $ 52.927 16.120 4,061 21.325 11,264 100.887 36,766 42522 180,175 2 3 4 S 6 7 8 Current Assets: 9 Cash and cash equivalents 10 Marketable securities 11 Accounts receivable, net 12 Inventories 13 Vendor non-trade receivables 14 Other cument assets 15 Total current assets 16 17 Non-current Assets: 18 Marketable securities 19 Property, plant and equipment, net 20 Other non-cument assets 21 Total non-cument assets 22 Total assets 23 24 25 Current liabilities: 26 Accounts payable 27 Other cument liabilities 28 Defemed revenue 29 Commercial paper 30 Temm debt 31 Total cunent liabilities 32 33 Non-current liabilities: 34 Tem debt 35 Other non-cument liabilities 36 Total non-cument liabilities 37 Total liabilities 38 39 Commitments and contingencies 40 41 Shareholders' equity: Common stock and additional paid-in capital, $0.00001 par value: 50,400,000 shares authorized; 16 426,786 and 16,976,763 shares issued and 42 outstanding, respectively 43 Retained carings 44 Accumulated other comprehensive income/loss) 45 Total shareholders equity 46 Total liabilities and shareholders' equity 47 48 34.940 5 134.836 S 27,699 26.278 6,580 25,228 14,111 127,877 39,440 48,849 216.166 351,002 S LIABILITIES AND SHAREHOLDERS' EQUITY: 54,763 47 493 7,612 6,000 9.613 125,481 109,106 53,325 162,431 287,912 57,365 5.562 163 63.090 $ 351,002 $ 38.016 $ 143.713 S 323.888 $ 42,296 42,684 6.643 4,996 8.773 105,392 98,667 54,490 153,157 258,349 50,779 14,966 406 65.339 September 28, 2019 51.713 22.926 4.106 22,878 12,352 105,341 37.378 32,978 175.697 323,888 S 48,844 162.819 338,516 46.236 37.720 5.522 5.980 10,260 105.718 91.807 50.303 142.310 248,028 45,174 45.898 384 90,488 338,516 Apple Inc. CONSOLIDATED STATEMENTS OF CASH FLOWS (In millions) September 25, 2021 8 Cash, cash equivalents and restricted cash, beginning balances 9 Operating activities: 10 Net income 94,680 11 Adjustments to reconcile net income to cash generated by operating activities: Depreciation and amortization 11284 12 13 Share-based compensation expense 7.906 14 Deferred income tax benefit -4,774 15 Other -147 16 Changes in operating assets and liabilities: 17 Accounts receivable, net -10,125 18 Inventories -2,642 19 Vendor non-trade receivables -3,903 20 Other current and non-current assets -8,042 21 Accounts payable 12,326 22 Deferred revenue 1,576 23 Other current and non-current liabilities 5.799 24 Cash generated by operating activities 25 Investing activities: 26 Purchases of marketable securities -109.558 27 Proceeds from maturities of marketable securities 59 023 28 Proceeds from sales of marketable securities 47 460 29 Payments for acquisition of property.plant and equipment -11,085 -33 30 Payments made in connection with business acquisitions.net Purchases of non-marketable securities 32 Proceeds from non-marketable securities 31 -131 387 33 Other -608 34 Cash generated by/(used in) investing activities -14545 35 Financing activities: 36 Proceeds from issuance of common stock 1,105 37 Payments for taxes related to net share settlement of equity awards -6556 38 Payments for dividends and dividend equivalents -14,467 39 Repurchases of common stock -85.971 40 Proceeds from issuance of term debt.net 20.393 41 Repayments of term debt -8.750 42 Proceeds from/(Repayments of) commercial paper,net 1022 43 Other -129 44 Cash used in financing activities -93.353 45 Increase/(Decrease) in cash, cash equivalents and restricted cash -3,860 46 Cash, cash equivalents and restricted cash, ending balances 47 Supplemental cash flow disclosure: 48 Cash paid for income taxes, net 49 Cash paid for interest 25.385 2,687 5.0 2 3 4 S 6 7 39,789 $ 104,038 35,929 $ Years ended September 26, 2020 57411 11,056 6829 -215 -97 6917 -127 1.553 -9,588 4,062 2,081 8,916 80,674 -114,938 69918 50,473 -7,309 -1524 -210 92 -791 4289 880 -3,634 -14.081 -72,358 16.091 -12.629 -963 -126 -86.820 -10.435 9501 3.002 50 224 $ 39,789 $ D September 28, 2019 55 256 12,547 6,068 -340 -652 245 -289 2931 873 -1923 -625 -4,700 69,391 -39,630 40,102 56.988 -10,495 -624 -1.001 1,634 -1078 45.896 781 -2817 -14.119 -66.397 6.963 -8.805 -5.977 -105 -90,976 24311 15.263 3,423 25,91 50,224 EXHIBIT A: EXAMPLE HISTORICAL AND COMPETITOR RATIOS (TAB 11) Wendy's Co. Historical Ratios For the years ended December 31, 2015, 2014, 2013 2015 2014 2013 Liquidity Current ratio Quick Ratio Leverage Ratios Debt to Total Assets Ratio Debt to Equity Ratio Long-Term Debt to Equity Times Interest Earned Ratio - Activity Ratios Inventory Turnover Fixed Assets Turnover Total Assets Turnover Accounts Receivable Turnover Average Collection Period Profitability Ratios Gross Profit Margin Operating Profit Margin Net Profit Margin Return on Total Assets (ROA) Return on Stockholders' Equity ( Earnings Per Share (EPS) Price Earnings Ratio XXX XXX xxxXxXxx XXX XXX XXX XXX xxxxXxXx Xxxx XXX xxx XXX XXX XXX XXX XXX XXX xxx XXX XXX XXX XXX XXX XXX XXX XXX XXX XXX XXX XXX xxxxx XXX XXX XXX XXX XXX XXX xxxx XXX XXX XXX XXX XXX XXX XXX XXX XXX XXX xxx XXX XXX XXX XXX COMPETITOR RATIO ANALYSIS McDonalds Hardees Taco Bell Industry Average XXX XXX Xxx Xxx XXX XXX XXX xxxx XXX XXXX XXX XXX XxxxXx XxXxx XXX XxXxx xxxxx XxXx Xxxxx Xxx Xxx xxx xxx XXX xxxx XXX XxXxxx XXX XXX XXX XXX xxXxx xxxx XXX xxx xxxx XxXx XXX XXX xxx xxx xxx xxx XXX XXX XXXX XXX XXxxx XXX Xxxx xxxxxx XXX xxx xxxxX xxxx xxxXxxxX Xxxxx xxxx xxxxxX XXX XxXxXxx Xxx xxx XXX XxXxx XXX Xxx Xxxx Page 4 of 4 12345 6 Year Ended June 30, 7 Revenue: 8 Product 9 Service and other 10 Total revenue 11 12 Cost of revenue: 13 Product 14 Service and other 15 Total cost of revenue 16 Gross margin 17 18 Research and development 19 Sales and marketing 20 General and administrative 21 22 Operating income 23 Other income, net 24 Income before income taxes 25 Provision for income taxes 26 Net income 27 Earnings per share: 28 Basic 29 Diluted 30 Weighted average shares outstanding: 31 Basic 32 33 34 35 6719 D A B June 30th, 2021 ITEM 8. FINANCIAL STATEMENTS AND SUPPLEMENTARY DATA MICROSOFT INCOME STATEMENTS (In Millions, except per share amounts) 2021 2020 S 71,074 S 68,041 S 97,014 74,974 168,088 143,015 18,219 16,017 34,013 30,061 52,232 46,078 115,856 96,937 20,716 19,269 20,117 19,598 5,107 5,111 69,916 52,959 1,186 77 71,102 53,036 9,831 8,755 61,271 S 44,281 S 8.12 S 5.82 S 8.05 S 5.76 S 7,547 7,610 7,608 7,683 Diluted $ S 2019 66,069 59,774 125,843 16,273 26,637 42,910 82,933 16,876 18,213 4,885 42,959 729 43,688 4,448 39,240 5.11 5.06 7,673 7,753 2 3 June 30, 4 5 Assets 6 Cument assets: 7 Cash and cash equivalents 8 Short-term investments 9 10 Total cash, cash equivalents, and short-term investments 11 Accounts receivable, net of allowance for doubtful accounts of $751 and $788 12 Inventones 13 Other cument assets 14 15 Total cument assets 16 Property and equipment, net of accumulated depreciation of $51,351 and $43,197 17 Operating lease right-of-use assets 18 Equity Investments 19 Goodwill 20 Intangible assets, net 21 Other long-term assets 22 23 Total assets 24 25 Liabilities and stockholders' equity 26 Curent liabilities: 27 Accounts payable 28 Current portion of long-tem debt 29 Accrued compensation 30 Short-term income taxes 31 Short-term uneamed revenue 32 Other curent liabilities 33 34 Total cument liabilities 35 Long-term debt 36 Long-term income taxes 37 Long-tem uneamed revenue 38 Defemed Income taxes 39 Operating lease liabilities 40 Other long-term liabilities 41 42 Total liabilities 43 44 Commitments and contingencies 45 Stockholders' equity: 46 Common stock and pald-in capital-shares authorized 24,000, outstanding 7,519 and 7,52 47 Retained eamings 48 Accumulated other comprehensive income 50 Total stockholders' equity 52 Total liabilities and stockholders' equity $ 5x2528& 45 51 53 MICROSOFT BALANCE SHEETS (h 54 $ 2021 14,224 S 116, 110 130,334 38,043 2,636 13.393 184,406 59,715 11,088 5.964 49,711 7,800 15.075 333.779 $ 15,163 $ 8,072 10.057 2,174 41,525 11,666 88,657 50,074 27,190 2,616 198 9,629 13.427 191,791 83,111 57,055 1.822 141.988 333.779 $ 2020 13,576 $ 122.951 136,527 32,011 1,895 11.482 181,915 44,151 8,753 2,965 43.351 7,038 13.138 301.311 S 12,530 $ 3,749 7,874 2,130 36.000 10,027 72,310 59.578 29,432 3,180 204 7,671 10,632 183,007 80,552 34,566 3.186 118,304 301.311 D 2019 11,356 122.463 133,819 29,524 2,063 10,146 175,552 36,477 7,379 2,649 42,026 7,750 14.723 286 556 9.382 5,516 6,830 5,665 32,676 9.351 69,420 66,662 29,612 4,530 233 6,166 7.581 184.226 78,520 24,150 340 102.330 286,556 LE TEL MICROSOFT CASH FLOWS STATEMENTS 2021 61,271 S 11,686 6,118 -1,249 -150 2 3ded J 30. 4 5 perations 6 et income 7 djustments to reconcile net income to net cash from operations: 8 epreciation, amortization, and other 9 tock-based compensation expense 10 et recognized gains on investments and derivatives 11 efemed income taxes 12 hanges in operating assets and liabilities: 13 ccounts receivable 14 ventores 15 ther cument assets 16 ther long-term assets 17 ccounts payable 18 neamed revenue 19 come taxes 20 ther cument liabilities 21 ther long-term liabilities 22 23 et cash from operations 24 25 inancing 26 ash premium on debt exchange 27 epayments of debt 28 ommon stock issued 29 ommon stock repurchased 30 ommon stock cash dividends paid 31 ther, net 32 33 et cash used in financing 34 35 vesting 36 dditions to property and equipment 37 cquisition of companies, net of cash acquired, and purchases of inta 38 urchases of investments 39 latunities of investments 40 ales of investments 41 ther, net 42 43 et cash used in investing 44 45 fect of foreign exchange rates on cash and cash equivalents 46 47 et change in cash and cash equivalents 48 ash and cash equivalents, beginning of period 49 50 ash and cash equivalents, end of period 51 4,481 -737 -932 -3,459 2,798 4,633 -2.309 4,149 1,402 76,740 -1,754 -3.750 1,693 -27,385 -16,521 -769 48.485 -20,622 8.909 42.924 51,792 14,008 922 -27,577 20 648 13.576 14.224 S 2020 44,281 12,796 5,289 -219 11 -2,577 168 -2,330 -1,037 3,018 2,212 -3,631 1,346 1,348 60.675 -3,417 -5.518 1,343 -22.968 -15,137 -334 48,031 -15,441 2.521 -77,190 66,449 17,721 -1.241 -12 223 201 2.220 11.350 13.576 S 2019 39,240 11,682 4,652 -792 -6,463 -2,812 597 -1.718 -1,834 232 4,462 2,929 1,419 591 52.185 0 4,000 1,142 -19,543 -13,811) 675 36.887 -13,925 -2,388 -57,697 20,043 38,194 0 -15,773 -115 -590 11,946 11.356 8 Alphabet Inc. CONSOLIDATED STATEMENTS OF INCOME (In millions, except per share amounts), 2021 257,637 $ 110,939 31,562 22,912 13,510 178,923 78,714 12,020 90,734 14,701 76,033 $ 113.88 $ 112.20 $ 4 Year Ended December 31, 6 Revenues 7 Costs and expenses: 8 Cost of revenues 9 Research and development 10 Sales and marketing 11 General and administrative 12 European Commission fines 13 Total costs and expenses 14 Income from operations 15 Other Income (expense), net 16 Income before income taxes 17 Provision for income taxes 18 19 Net income 20 21 Basic net income per share of Class A and B common stock 22 and Class C capital stock 23 24 Diluted net income per share of Class A and B common stock 25 and Class C capital stock 26 27 $ $ $ 2020 182,527 $ 84,732 27,573 17,946 11,052 0 141,303 41,224 6,858 48,082 7.813 40,269 $ 59.15 $ 58.61 $ D 2019 161,857 71,896 26,018 18,454 9,551 1,697 127,626 34,231 5,394 39,625 5,282 34,343 49.59 49.16 Alphabet Inc. CONSOLIDATED BALANCE SHEETS On millions, except share amounts which are reflected in thousands, and par value per share amounts) 2021 2020 20,945 $ 115.704 139,649 39,304 966 1,170 7,054 188,143 29,549 1,284 97,599 12,959 1,417 22,956 5.361 359 268 $ 6,037 13,889 31,236 8,996 3,288 4 As of December 31, 5 Assets 6 Curent assets 7 Cash and cash gets 8 Marketable soortes 9 Total cash, cash equivalents, and marketable securtas 10 Accounts receivable, net 11 12 Income taxes receivable net 13 Invertory 14 Other current ass 15 Total oument an 16 Non-marketabesc 17 Deferred income tax 18 Property and equipment, net 19 Operating sets 20 intangible assets, net 21 Good 22 Other non-ouer assets 23 Total mets 24 Liabilities and Stockholders' Equity 25 Curent 26 Accounts payab 27 28 Accrund compensation and benets 29 Accrued expenses and other current labities 30 Accrued revenue share 31 32 Deferred revenue 33 Income taxes payable net 34 Taal ou 35 Long term de 36 Deferred revenue, non-current 37 Income taxes payable, non-curr 38 Deferred income ta 39 Operating e b 40 Other long-lem 41 Total habit 42 Contingencies Note 10 43 Y GAY 44 Preferred stock, 30 001 par vakum per share 100.000 shares authored no shares d 45 and outsanding 46 Cans A and Cams B common stock, and Cles C capital stock and anal pas cap 470001 perve per share 15.000.000shares authoried (Class A 8.000.000 Class 3,000,000 48 C C 3,000,000 671,222 (Cs A 300,730 C 45,643, CC364 49 50 Accumuted other comprehensive income) 51 Pardings 52 Tota stockho 53 Totals and they 54 808 64,254 14,817 535 9,176 5,257 11,389 2,205 107.633 61,774 -1,623 191.454 251.635 359.204 26,465 110,229 136,694 30,930 454 728 5.490 174,296 20,703 1,084 84,749 12,211 1,445 21,175 3,953 319,616 5,589 $ 11,086 28,631 7,500 2,543 1,485 56,834 13.932 481 8,849 3,561 11,146 2,269 97,072 58,510 633 163.401 222.544 319.016 $ 2019 18,498 101,177 119,675 25,326 2,166 999 4,412 152,578 13,078 721 73,646 10,941 1,979 20,624 2,342 275.909 5,561 8,495 23,067 5,916 1,908 274 45,221 4,554 358 9,885 1,701 10,214 2,534 74,467 50,552 1,232 152,122 201,442 275,909 |||| C49 1 X Jx 8 Alphabet Inc. CONSOLIDATED STATEMENTS OF CASH FLOWS (In millions) 2021 76,033 $ 11,555 886 15,376 1,808 -12,270 -213 -9,095 -625 -1,846 283 7,304 1,682 774 91,652 -24,640 -135,196 128,294 -2,838 934 -2,618 541 -35,523 -10,162 -50,274 20,199 -21,435 310 -61,362 -287 -5,520 26,465 20,945 $ 13,412 S 2 3 4 Your Ended December 31, 5 Operating activities 6 Net income. 7 Adjustments 8 Depreciation and impairment of property and equipment 9 Amortization and impairment of intangible assets 10 Stock-based compensation expense 11 Deferred Income taxes 12 Gain on debt and equity securities, net 13 Other 14 Changes in assets and liabilities, net of effects of acquisitions: 15 Accounts receivable 16 Income taxes, net 17 Other assets 18 Accounts payable 19 Accrued expenses and other liabilities 20 Accrued revenue share 21 Deferred revenue 22 Net cash provided by operating activities 23 Investing activities 24 Purchases of property and equipment 25 Purchases of marketable securities 26 Maturities and sales of marketable securities 27 Purchases of non-marketable securities 28 Maturities and sales of non-marketable securities 29 30 Acquisitions, net of cash acquired, and purchases of intangible assets 31 32 Other investing activities 33 Net cash used in investing activities 34 Financing activities 35 Net payments related to stock-based award activities 36 37 Repurchases of common and capital stock 38 Proceeds from issuance of debt, net of costs 39 Repayments of debt 40 Proceeds from sale of interest in consolidated entities, net 41 Net cash used in financing activities 42 Effect of exchange rate changes on cash and cash equivalents 43 Net increase (decrease) In cash and cash equivalents 44 Cash and cash equivalents at beginning of period 45 Cash and cash equivalents at end of period 46 47 Supplemental disclosures of cash flow information 48 Cash paid for income taxes, net of refunds 49 50 2020 40,269 $ 12,905 792 12,991 1,390 -6,317 1,267 -6,524 1,200 -1,330 694 5,504 1,639 635 65,124 -22,281 -136,576 132,906 -7,175 1,023 -738 -32,773 -5.720 -31,149 11,761 -2,100 2.800 -24,408 24 7,967 18.498 26,465 $ 4,990 $ D 2019 34,343 10,856 925 10,794 173 -2,796 -502 -4,340 -3,128 -621 428 7,170 1,273 37 54,520 -23,548 -100,315 97,825 -1,932 405 -2,515 589 -29,491 -4,765 -18,396 317 -585 220 -23,200 -23 1.797 16,701 18,498 8,203
Step by Step Solution
There are 3 Steps involved in it

Get step-by-step solutions from verified subject matter experts