

Question: Historical returns. Calculate the arithmetic average return of U.S. Treasury bills, long-term government bonds, and large-company stocks for 1988 to 1997 . Which had the
Historical returns. Calculate the arithmetic average return of U.S. Treasury bills, long-term government bonds, and large-company stocks for 1988 to 1997 . Which had the highest return? Which had the lowest return? On the left side, click on the Spreadsheet Learning Aid to see Table 8.1long dash Year-by-Year Returns, 1950-1999. What is the average return of U.S. Treasury bills for 1988 to 1997 ? nothing % (Round to two decimal places.)
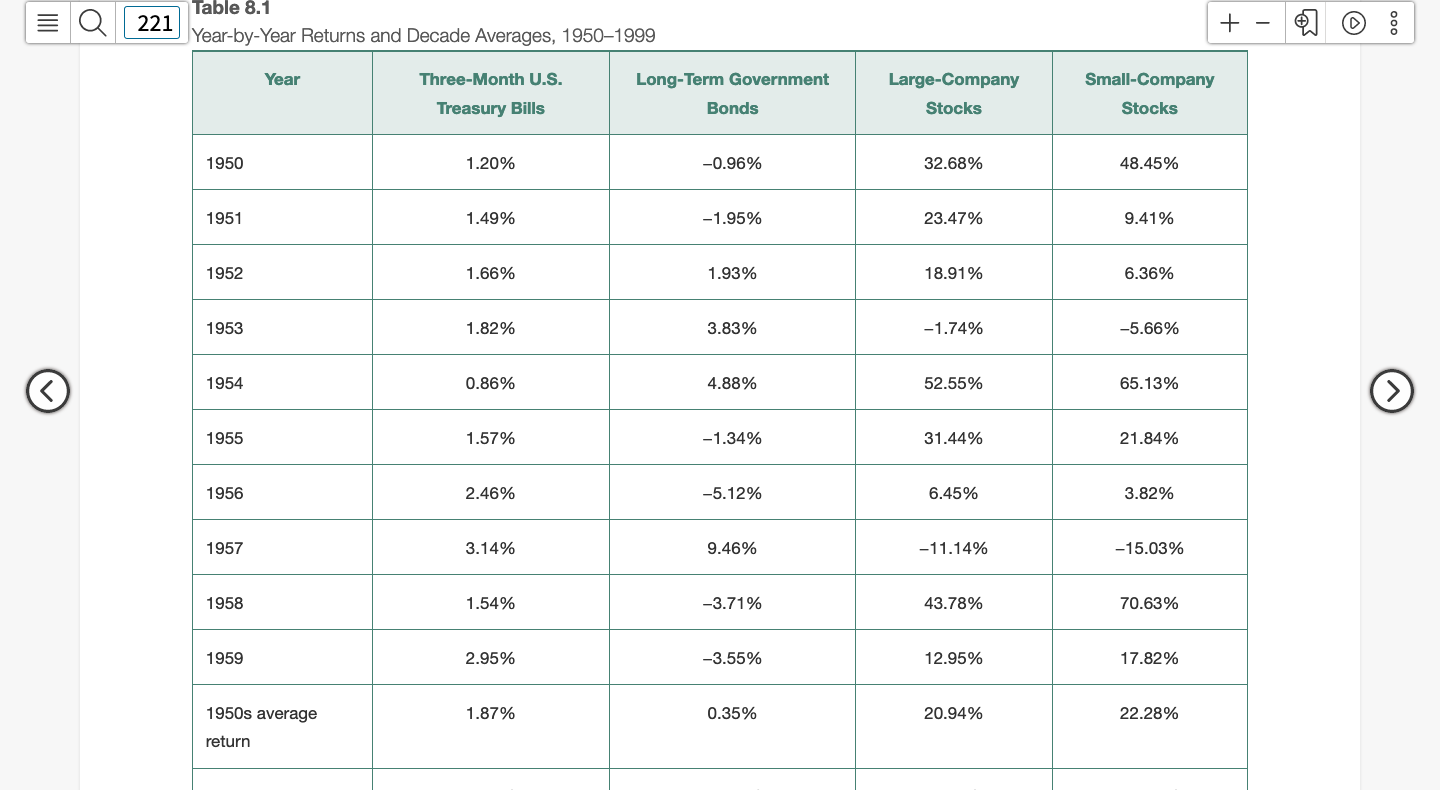
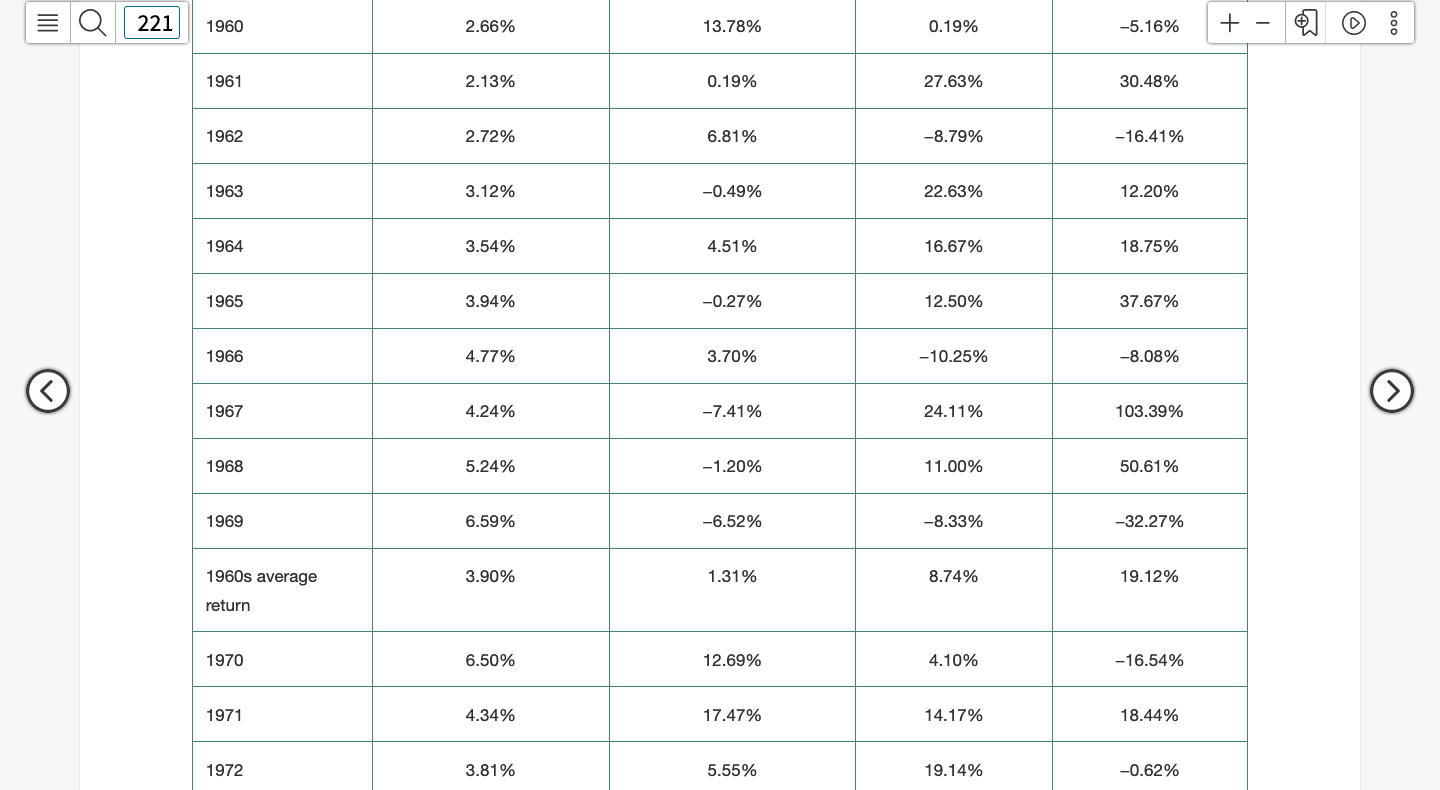
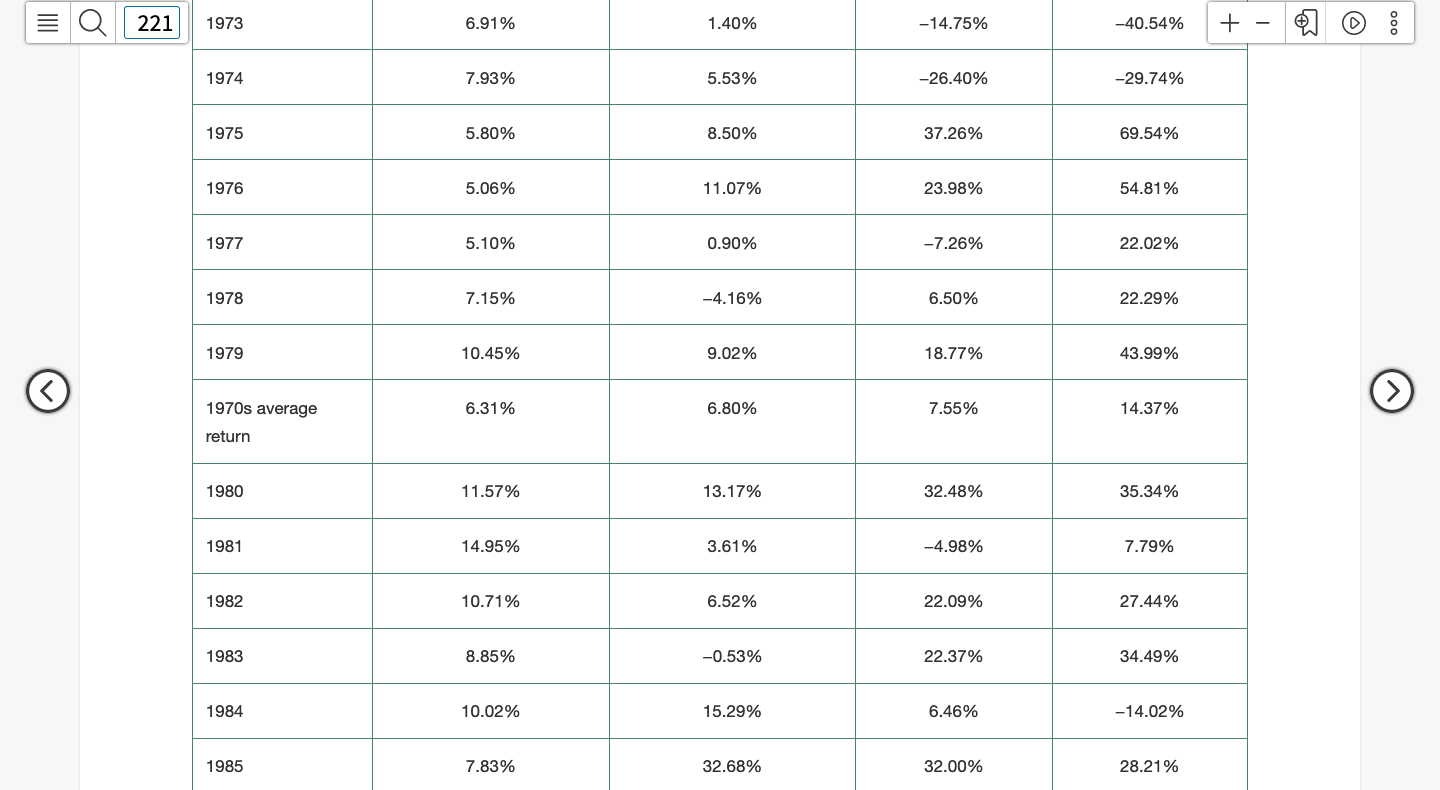
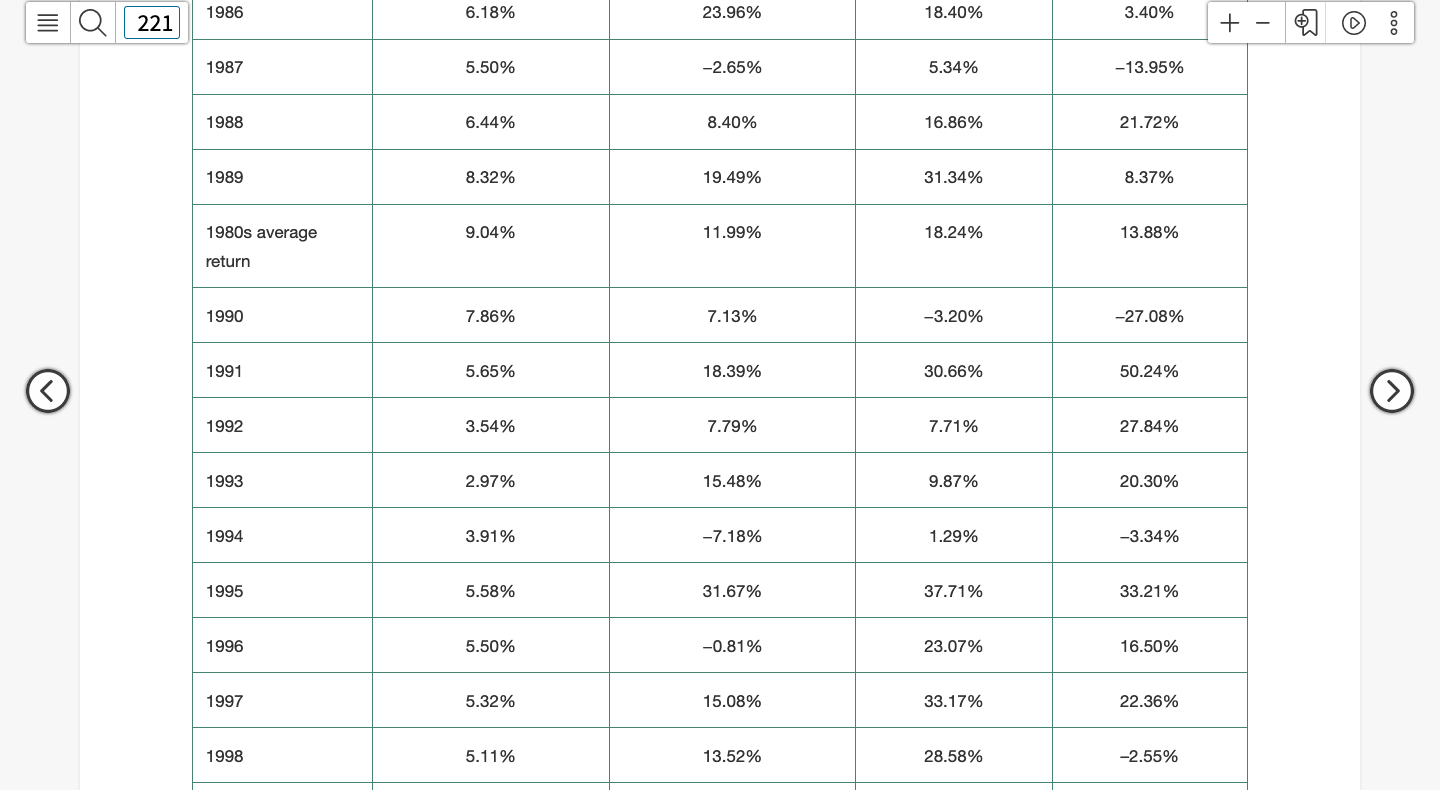
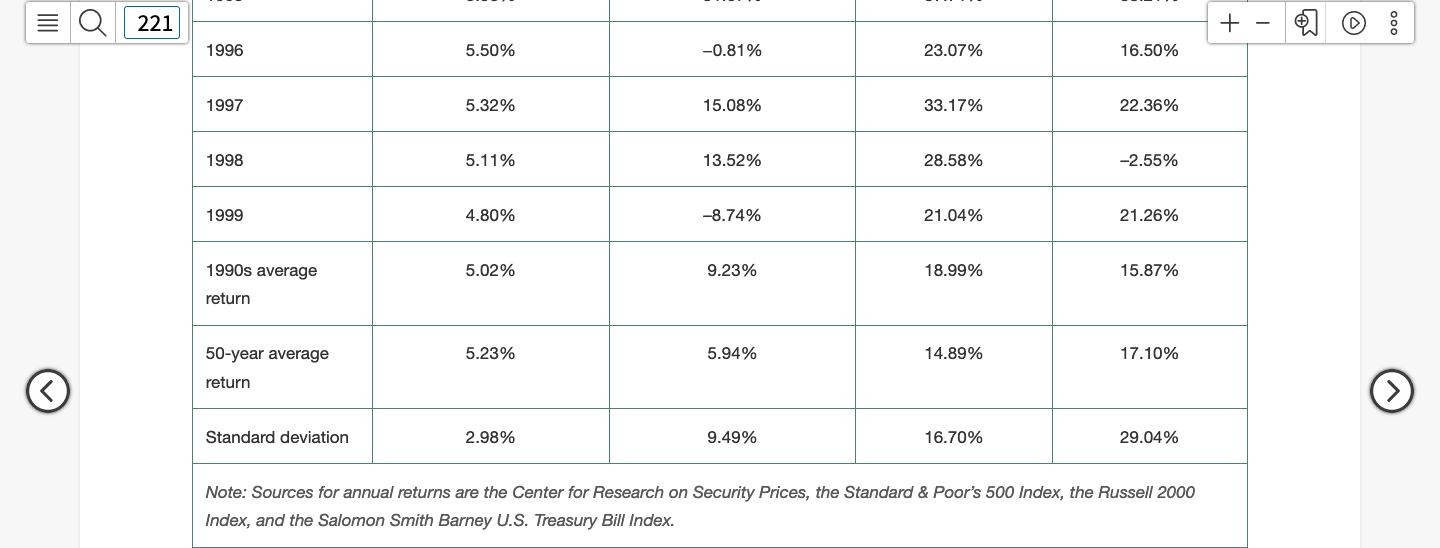
L 221 Table 8.1 Year-by-Year Returns and Decade Averages, 19501999 + Year Three-Month U.S. Long-Term Government Bonds Large-Company Stocks Small-Company Stocks Treasury Bills 1950 1.20% -0.96% 32.68% 48.45% 1951 1.49% -1.95% 23.47% 9.41% 1952 1.66% 1.93% 18.91% 6.36% 1953 1.82% 3.83% -1.74% -5.66% 1954 0.86% 4.88% 52.55% 65.13% 1955 1.57% -1.34% 31.44% 21.84% 1956 2.46% -5.12% 6.45% 3.82% 1957 3.14% 9.46% -11.14% -15.03% 1958 1.54% -3.71% 43.78% 70.63% 1959 2.95% -3.55% 12.95% 17.82% 1950s average 1.87% 0.35% 20.94% 22.28% return L 221 1960 2.66% 13.78% 0.19% -5.16% + 1961 2.13% 0.19% 27.63% 30.48% 1962 2.72% 6.81% -8.79% -16.41% 1963 3.12% -0.49% 22.63% 12.20% 1964 3.54% 4.51% 16.67% 18.75% 1965 3.94% -0.27% 12.50% 37.67% 1966 4.77% 3.70% - 10.25% -8.08% 1967 4.24% -7.41% 24.11% 103.39% 1968 5.24% -1.20% 11.00% 50.61% 1969 6.59% -6.52% -8.33% -32.27% 1960s average 3.90% 1.31% 8.74% 19.12% return 1970 6.50% 12.69% 4.10% -16.54% 1971 4.34% 17.47% 14.17% 18.44% 1972 3.81% 5.55% 19.14% -0.62% 221 1973 6.91% 1.40% -14.75% -40.54% + 1974 7.93% 5.53% -26.40% -29.74% 1975 5.80% 8.50% 37.26% 69.54% 1976 5.06% 11.07% 23.98% 54.81% 1977 5.10% 0.90% -7.26% 22.02% 1978 7.15% -4.16% 6.50% 22.29% 1979 10.45% 9.02% 18.77% 43.99% 1970s average 6.31% 6.80% 7.55% 14.37% return 1980 11.57% 13.17% 32.48% 35.34% 1981 14.95% 3.61% -4.98% 7.79% 1982 10.71% 6.52% 22.09% 27.44% 1983 8.85% -0.53% 22.37% 34.49% 1984 10.02% 15.29% 6.46% -14.02% 1985 7.83% 32.68% 32.00% 28.21% 1986 6.18% 23.96% 18.40% 3.40% 221 + 1987 5.50% -2.65% 5.34% -13.95% 1988 6.44% 8.40% 16.86% 21.72% 1989 8.32% 19.49% 31.34% 8.37% 1980s average 9.04% 11.99% 18.24% 13.88% return 1990 7.86% 7.13% -3.20% -27.08% 1991 5.65% 18.39% 30.66% 50.24% 1992 3.54% 7.79% 7.71% 27.84% 1993 2.97% 15.48% 9.87% 20.30% 1994 3.91% -7.18% 1.29% -3.34% 1995 5.58% 31.67% 37.71% 33.21% 1996 5.50% -0.81% 23.07% 16.50% 1997 5.32% 15.08% 33.17% 22.36% 1998 5.11% 13.52% 28.58% -2.55% 221 + 1996 5.50% -0.81% 23.07% 16.50% 1997 5.32% 15.08% 33.17% 22.36% 1998 5.11% 13.52% 28.58% -2.55% 1999 4.80% -8.74% 21.04% 21.26% 1990s average 5.02% 9.23% 18.99% 15.87% return 50-year average 5.23% 5.94% 14.89% 17.10% return Standard deviation 2.98% 9.49% 16.70% 29.04% Note: Sources for annual returns are the Center for Research on Security Prices, the Standard & Poor's 500 Index, the Russell 2000 Index, and the Salomon Smith Barney U.S. Treasury Bill Index. L 221 Table 8.1 Year-by-Year Returns and Decade Averages, 19501999 + Year Three-Month U.S. Long-Term Government Bonds Large-Company Stocks Small-Company Stocks Treasury Bills 1950 1.20% -0.96% 32.68% 48.45% 1951 1.49% -1.95% 23.47% 9.41% 1952 1.66% 1.93% 18.91% 6.36% 1953 1.82% 3.83% -1.74% -5.66% 1954 0.86% 4.88% 52.55% 65.13% 1955 1.57% -1.34% 31.44% 21.84% 1956 2.46% -5.12% 6.45% 3.82% 1957 3.14% 9.46% -11.14% -15.03% 1958 1.54% -3.71% 43.78% 70.63% 1959 2.95% -3.55% 12.95% 17.82% 1950s average 1.87% 0.35% 20.94% 22.28% return L 221 1960 2.66% 13.78% 0.19% -5.16% + 1961 2.13% 0.19% 27.63% 30.48% 1962 2.72% 6.81% -8.79% -16.41% 1963 3.12% -0.49% 22.63% 12.20% 1964 3.54% 4.51% 16.67% 18.75% 1965 3.94% -0.27% 12.50% 37.67% 1966 4.77% 3.70% - 10.25% -8.08% 1967 4.24% -7.41% 24.11% 103.39% 1968 5.24% -1.20% 11.00% 50.61% 1969 6.59% -6.52% -8.33% -32.27% 1960s average 3.90% 1.31% 8.74% 19.12% return 1970 6.50% 12.69% 4.10% -16.54% 1971 4.34% 17.47% 14.17% 18.44% 1972 3.81% 5.55% 19.14% -0.62% 221 1973 6.91% 1.40% -14.75% -40.54% + 1974 7.93% 5.53% -26.40% -29.74% 1975 5.80% 8.50% 37.26% 69.54% 1976 5.06% 11.07% 23.98% 54.81% 1977 5.10% 0.90% -7.26% 22.02% 1978 7.15% -4.16% 6.50% 22.29% 1979 10.45% 9.02% 18.77% 43.99% 1970s average 6.31% 6.80% 7.55% 14.37% return 1980 11.57% 13.17% 32.48% 35.34% 1981 14.95% 3.61% -4.98% 7.79% 1982 10.71% 6.52% 22.09% 27.44% 1983 8.85% -0.53% 22.37% 34.49% 1984 10.02% 15.29% 6.46% -14.02% 1985 7.83% 32.68% 32.00% 28.21% 1986 6.18% 23.96% 18.40% 3.40% 221 + 1987 5.50% -2.65% 5.34% -13.95% 1988 6.44% 8.40% 16.86% 21.72% 1989 8.32% 19.49% 31.34% 8.37% 1980s average 9.04% 11.99% 18.24% 13.88% return 1990 7.86% 7.13% -3.20% -27.08% 1991 5.65% 18.39% 30.66% 50.24% 1992 3.54% 7.79% 7.71% 27.84% 1993 2.97% 15.48% 9.87% 20.30% 1994 3.91% -7.18% 1.29% -3.34% 1995 5.58% 31.67% 37.71% 33.21% 1996 5.50% -0.81% 23.07% 16.50% 1997 5.32% 15.08% 33.17% 22.36% 1998 5.11% 13.52% 28.58% -2.55% 221 + 1996 5.50% -0.81% 23.07% 16.50% 1997 5.32% 15.08% 33.17% 22.36% 1998 5.11% 13.52% 28.58% -2.55% 1999 4.80% -8.74% 21.04% 21.26% 1990s average 5.02% 9.23% 18.99% 15.87% return 50-year average 5.23% 5.94% 14.89% 17.10% return Standard deviation 2.98% 9.49% 16.70% 29.04% Note: Sources for annual returns are the Center for Research on Security Prices, the Standard & Poor's 500 Index, the Russell 2000 Index, and the Salomon Smith Barney U.S. Treasury Bill Index
Step by Step Solution
There are 3 Steps involved in it

Get step-by-step solutions from verified subject matter experts