

History of Data: The dataset was compiled by David Harrison of Harvard and Daniel Rubenfeld of University
Question:
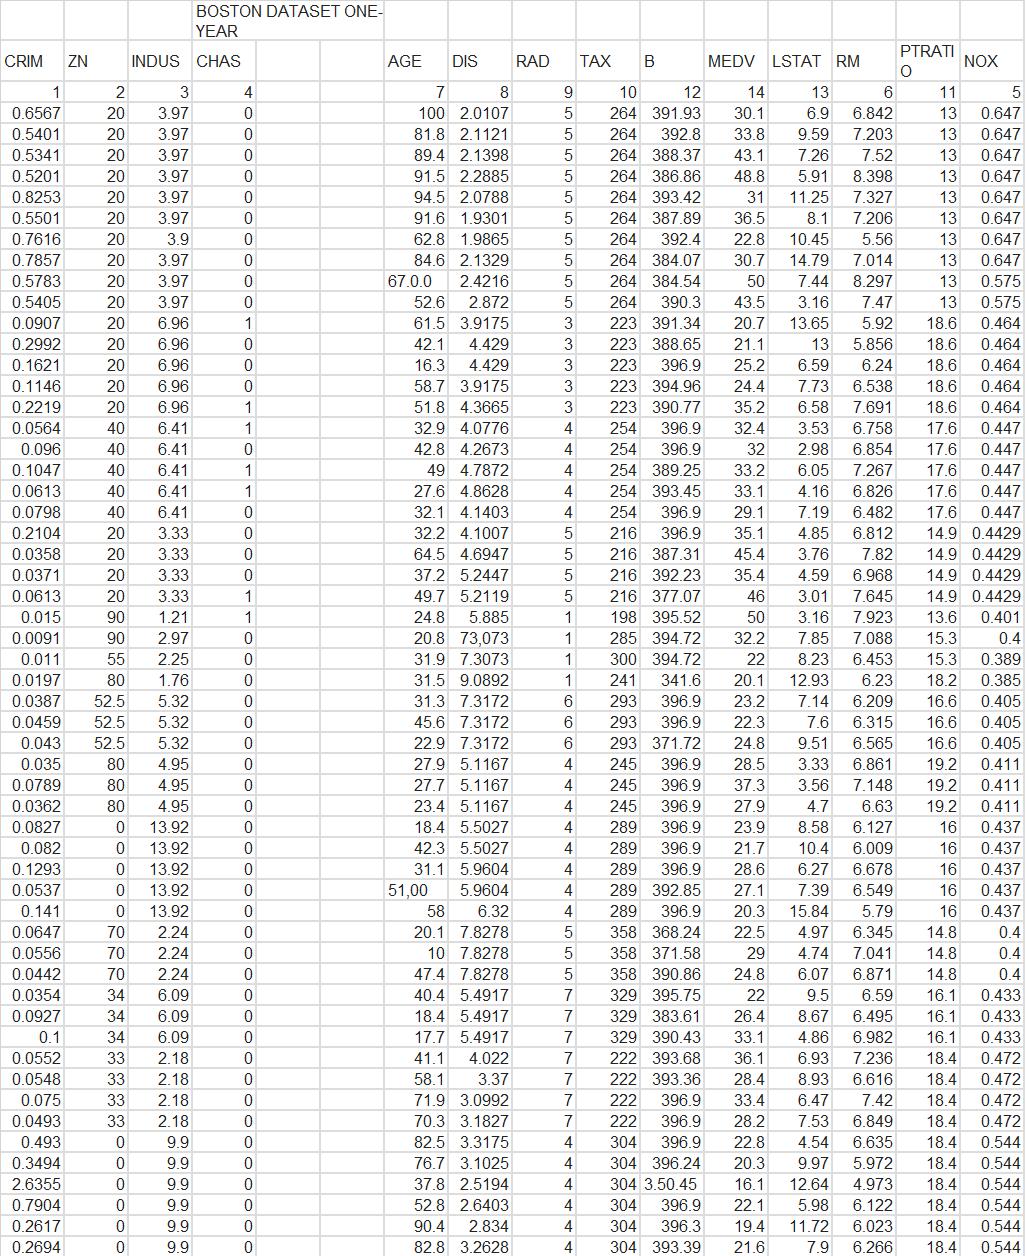
History of Data: The dataset was compiled by David Harrison of Harvard and Daniel Rubenfeld of University of Michigan who in the late 1970’s investigated the relationship between housing values and the willingness to pay for clean air. The hypothesis in this study proposes that environmental pollution should have a negative impact on house prices. The Boston Housing Dataset contains 506 observations and includes 14 non-constant independent variables, which are listed below.
1. CRIM per capita crime rate by town
2. ZN proportion of residential land zoned for lots over 25,000 sq. ft.
3. INDUS proportion of non-retail business acres per town
4. CHAS Charles River dummy variable (= 1 if tract bounds river; 0 otherwise)
5. NOX nitric oxides concentration (parts per 10 million)
6. RM average number of rooms per dwelling
7. AGE proportion of owner-occupied units built prior to 1940
8. DIS weighted distances to five Boston employment centers
9. RAD index of accessibility to radial highways
10. TAX full-value property-tax rate per $10,000
11. PTRATIO pupil-teacher ratio by town
12. B 1000(Bk - 0.63) ^2 where Bk is the proportion of blacks by town
13. LSTAT % lower status of the population
14. MEDV (Y) Median value of owner-occupied homes in $1000\'s (response variable)
A. From the variables given: Build a model to test, i.e., choose the dependent variable and the independent variable or variables. You must justify your choice of dependent variables and independent variables (this means justifying excluding variables as well). Justify whether you would expect the independent variable(s) to have a positive or negative effect on the dependent variable. You must also justify your choice of a linear or non-linear model.
Theory Formation:
Multiple regression is used when we want to predict the value of a variable based on the value of two or more other variables. The variables we are using to predict the value of the dependent variable are called the independent variables. A dependent or target variable, in this case the monetary value of houses (MEDV) , is dependent on (in this case three independent variables) and is the variable we seek to predict.
To predict the value of houses, a multiple regression model will be constructed with the following features (independent variables): NOX (nitric oxides concentration (parts per 10 million), RM (average number of rooms per dwelling), LSTAT (% lower status of the population), and PTRATIO (pupil-teacher ratio by town).
The justification for selecting the four features (independent variables) above are as follows: The hypothesis is based on the theory that higher Nitric Oxide concentrations have a direct impact on housing prices. This would related to a negative impact on housing values. One would expect that a higher RM, would be related to a higher MEDV. This is due to the fact larger houses (more rooms) typically cost more and, therefore, have a positive impact on the MEDV. Regarding LSTAT, one would expect to observe a lower MEDV with a higher LSTAT, therefore, this feature has a negative impact on MEDV. Generally speaking, a neighborhood with “lower class” citizens will have housing with lower prices, thus a negative impact on MEDV. For a higher LSTAT, one would expect to observe a lower MEDV. Typically, a lower teacher-to-student ratio is related to lower performance in students, which is more typical for areas with lower housing costs. Consequently, this feature has a negative impact on MEDV.
Conversely, the nine non-constant independent variables not selected for this study include: CRIM, ZN, INDUS, CHAS, AGE, DIS, RAD, TAX and B . While crime often appears in areas of lower housing values, it seems to be a result of lower economic status, not a predictor of lower housing values. Regarding ZN and INDUS, proportion of residential land zoned for lots over 25,000 sq. ft. and proportion of non-retail business acres per town do not seem to have a direct relationship to MEDV…………
Calculate Statistics:
B. Carefully and completely explain your results.
C. Test- conduct all hypothesis tests discussed in class on your model.
Expert Answer:
Solution To make this question a little simpler we will solve this in excel sheet of which some pict... View the full answer


Operations Management in the Supply Chain Decisions and Cases
ISBN: 978-0073525242
6th edition
Authors: Roger Schroeder, M. Johnny Rungtusanatham, Susan Goldstein
