

Question: Ho:___________Ha:____________ Test Statistic:__________ RR: __________ P-value:__________ Part 3: Relative Risk and Odds Ratio Typhoon Saomei caused high rates of injuries and deaths in the Longhua
Ho:___________Ha:____________
Test Statistic:__________ RR: __________
P-value:__________
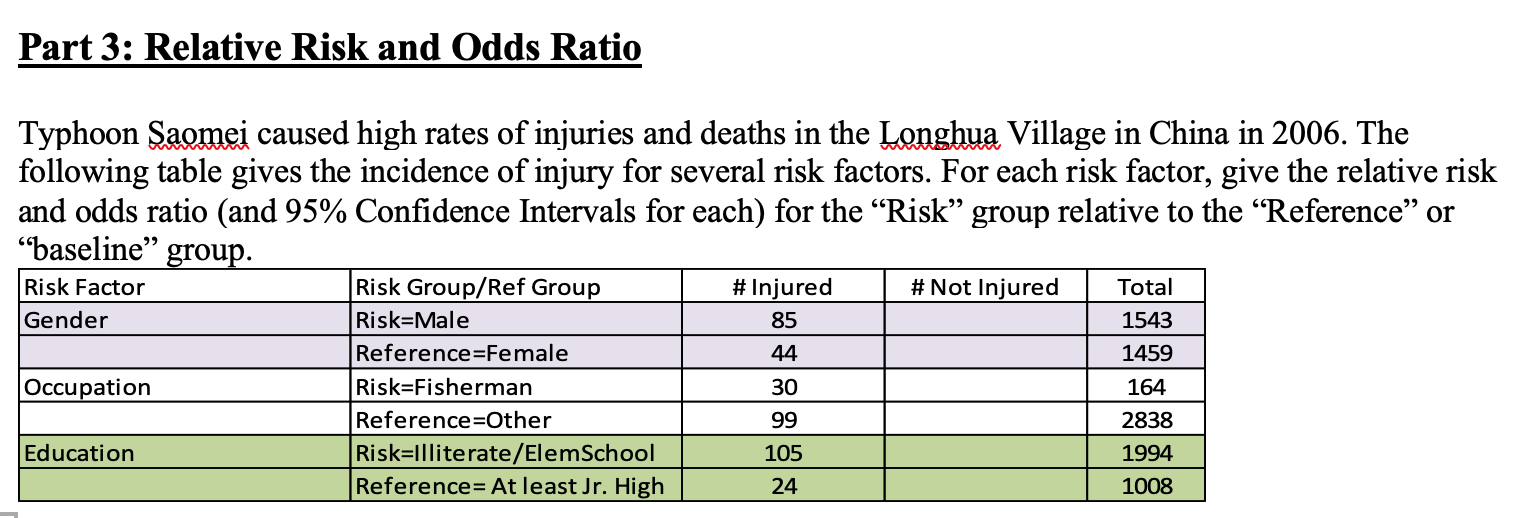
Part 3: Relative Risk and Odds Ratio Typhoon Saomei caused high rates of injuries and deaths in the Longhua Village in China in 2006. The following table gives the incidence of injury for several risk factors. For each risk factor, give the relative risk and odds ratio (and 95% Confidence Intervals for each) for the "Risk" group relative to the "Reference" or "baseline" group. Risk Factor Risk Group/Ref Group # Injured # Not Injured Total Gender Risk=Male 85 1543 Reference=Female 44 1459 Occupation Risk=Fisherman 30 164 Reference=Other 99 2838 Education Risk=Illiterate/ElemSchool 105 1994 Reference= At least Jr. High 24 1008
Step by Step Solution
There are 3 Steps involved in it

Get step-by-step solutions from verified subject matter experts