

Question: hollbrook https://www.mathxl.com/Student/PlayerHomework.aspx?homeworkld = 5256708158questi ACCT& 202 Section DE (Spring 2019) Homework: Homework # 26 core: 0 of 1 pt 5 of 12 (8 complete) HW
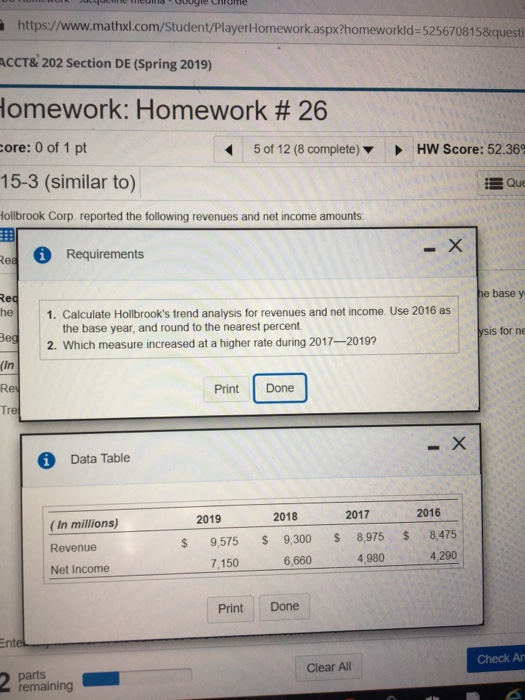
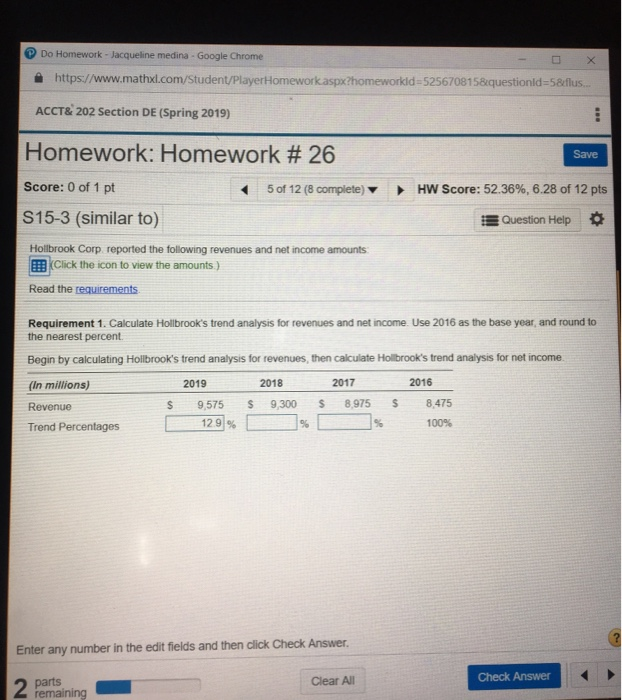
https://www.mathxl.com/Student/PlayerHomework.aspx?homeworkld = 5256708158questi ACCT& 202 Section DE (Spring 2019) Homework: Homework # 26 core: 0 of 1 pt 5 of 12 (8 complete) HW Score: 52.36 15-3 (similar to) Que Hollbrook Corp. reported the following revenues and net income amounts - X Requirements Rea he base y Red 1. Calculate Hollbrook's trend analysis for revenues and net income. Use 2016 as the base year, and round to the nearest percent 2. Which measure increased at a higher rate during 2017-2019? he ysis for ne Bed (In Re Done Print Tre - X Data Table 2016 2017 2018 2019 (In millions) 8,475 S 8,975 S 9,300 9,575 $ Revenue 4,290 4,980 6,660 7,150 Net Income Done Print Entel Check An Clear All parts remaining 2 P Do Homework - Jacqueline medina - Google Chrome X https://www.mathxl.com/Student/PlayerHomework.aspx?homeworkld-5256708158questionld-5&flus... ACCT& 202 Section DE (Spring 2019) Homework: Homework # 26 Save Score: 0 of 1 pt 5 of 12 (8 complete) HW Score: 52.36%, 6.28 of 12 pts S15-3 (similar to) Question Help Hollbrook Corp reported the following revenues and net income amounts EEClick the icon to view the amounts) Read the requirements Requirement 1. Calculate Hollbrook's trend analysis for revenues and net income. Use 2016 as the base year, and round to the nearest percent Begin by calculating Hollbrook's trend analysis for revenues, then calculate Hollbrook's trend analysis for net income. 2017 2016 2018 (In millions) 2019 S 8,975 8,475 9,575 9,300 Revenue 129 % % 100% Trend Percentages Answer. Enter any number in the edit fields and then click C Check Answer Clear All parts remaining 2
Step by Step Solution
There are 3 Steps involved in it

Get step-by-step solutions from verified subject matter experts