

Question: Home Comments V Paste Dictate Editor V V 1 1 3 4 6 7 8 9 11 5 1 13 14 15 16 17 11
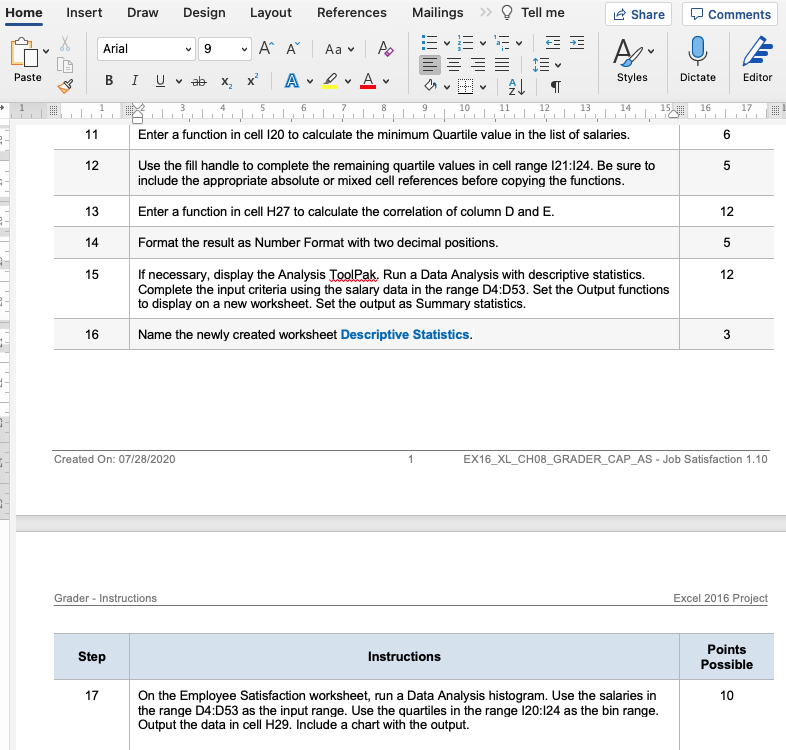
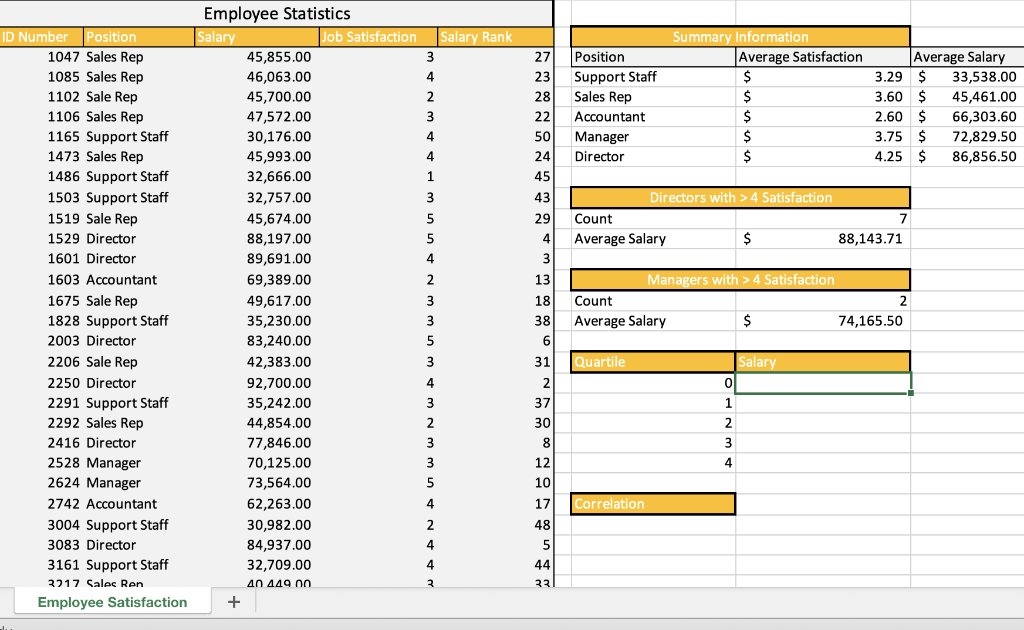
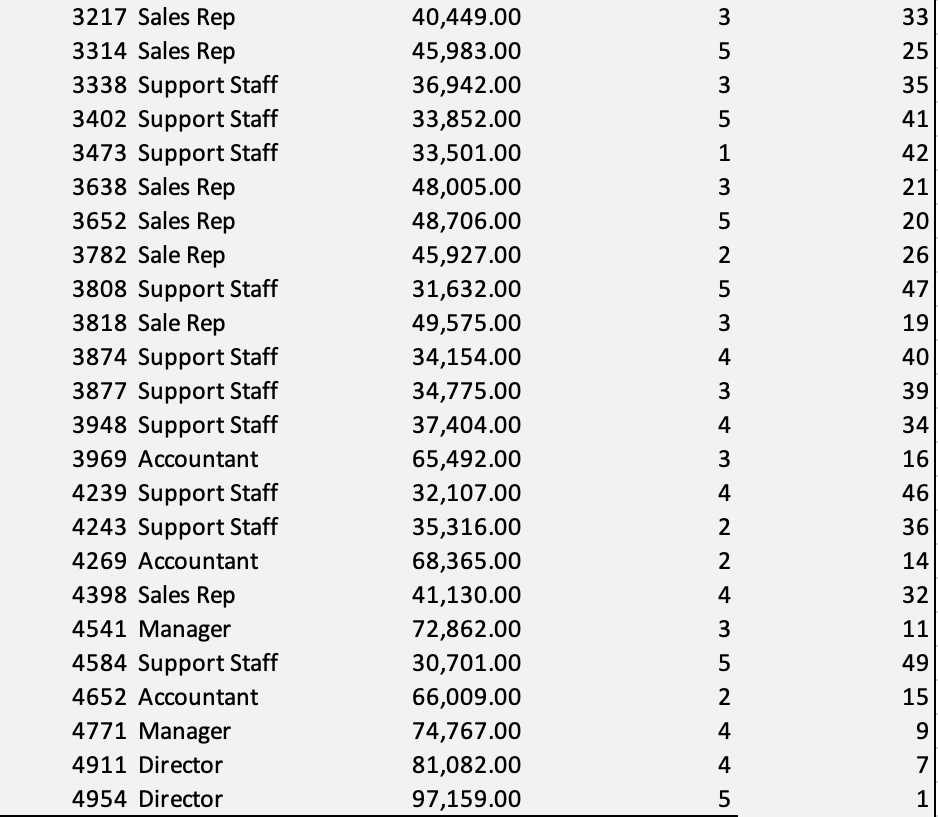
Home Comments V Paste Dictate Editor V V 1 1 3 4 6 7 8 9 11 5 1 13 14 15 16 17 11 6 12 5 Insert Draw Design Layout References Mailings >> Tell me Share X Arial 9 AF Aa v to ES ab X | A Styles AL 12 LL LLP,1,10 ! Enter a function in cell 120 to calculate the minimum Quartile value in the list of salaries. Use the fill handle to complete the remaining quartile values in cell range 121:124. Be sure to include the appropriate absolute or mixed cell references before copying the functions. 13 Enter a function in cell H27 to calculate the correlation of column D and E. 14 Format the result as Number Format with two decimal positions. 15 If necessary, display the Analysis ToolPak. Run a Data Analysis with descriptive statistics. Complete the input criteria using the salary data in the range D4D53. Set the Output functions to display on a new worksheet Set the output as Summary statistics. 16 Name the newly created worksheet Descriptive Statistics. 12 5 12 3 Created On: 07/28/2020 1 EX16_XL_CH08_GRADER_CAP_AS - Job Satisfaction 1.10 Grader - Instructions Excel 2016 Project Step Instructions Points Possible 17 10 On the Employee Satisfaction worksheet, run a Data Analysis histogram. Use the salaries in the range D4:053 as the input range. Use the quartiles in the range 120:124 as the bin range. Output the data in cell H29. Include a chart with the output. Position Support Staff Sales Rep Accountant Manager Director Summary Information Average Satisfaction $ $ $ $ $ $ Average Salary 3.29 $ 33,538.00 3.60 $ 45,461.00 2.60 $ 66,303.60 3.75 $ 72,829.50 4.25 $ 86,856.50 Directors with > 4 Satisfaction Count 7 Average Salary $ 88,143.71 ID Number Position 1047 Sales Rep 1085 Sales Rep 1102 Sale Rep 1106 Sales Rep 1165 Support Staff 1473 Sales Rep 1486 Support Staff 1503 Support Staff 1519 Sale Rep 1529 Director 1601 Director 1603 Accountant 1675 Sale Rep 1828 Support Staff 2003 Director 2206 Sale Rep 2250 Director 2291 Support Staff 2292 Sales Rep 2416 Director 2528 Manager 2624 Manager 2742 Accountant 3004 Support Staff 3083 Director 3161 Support Staff 2217 Sales Ren Employee Satisfaction Employee Statistics Salary Job Satisfaction Salary Rank 45,855.00 3 46,063.00 4 45,700.00 2 47,572.00 3 3 30,176.00 4 45,993.00 4 32,666.00 1 32,757.00 3 45,674.00 5 88,197.00 5 89,691.00 4 69,389.00 2 2 49,617.00 3 35,230.00 3 83,240.00 5 5 42,383.00 3 92,700.00 4 35,242.00 3 44,854.00 2 77,846.00 3 3 70,125.00 3 73,564.00 5 5 62,263.00 4 30,982.00 2 84,937.00 4 4 32,709.00 4 40 4490 + 27 23 28 22 50 24 45 43 29 4 4 3 3 13 18 38 6 31 2 37 30 8 12 Managers with > 4 Satisfaction Count 2 Average Salary $ 74,165.50 Quartile Salary 0 1 2 3 4 10 Correlation 17 48 5 44 23 3 5 3 5 1 3 5 2 5 3 4 3 3217 Sales Rep 3314 Sales Rep 3338 Support Staff 3402 Support Staff 3473 Support Staff 3638 Sales Rep 3652 Sales Rep 3782 Sale Rep 3808 Support Staff 3818 Sale Rep 3874 Support Staff 3877 Support Staff 3948 Support Staff 3969 Accountant 4239 Support Staff 4243 Support Staff 4269 Accountant 4398 Sales Rep 4541 Manager 4584 Support Staff 4652 Accountant 4771 Manager 4911 Director 4954 Director 40,449.00 45,983.00 36,942.00 33,852.00 33,501.00 48,005.00 48,706.00 45,927.00 31,632.00 49,575.00 34,154.00 34,775.00 37,404.00 65,492.00 32,107.00 35,316.00 68,365.00 41,130.00 72,862.00 30,701.00 66,009.00 74,767.00 81,082.00 97,159.00 33 25 35 41 42 21 20 26 47 19 40 39 34 16 46 36 14 32 11 49 15 9 7 7 1 4 3 4 2 2 4 3 5 2 4 4 5 Home Comments V Paste Dictate Editor V V 1 1 3 4 6 7 8 9 11 5 1 13 14 15 16 17 11 6 12 5 Insert Draw Design Layout References Mailings >> Tell me Share X Arial 9 AF Aa v to ES ab X | A Styles AL 12 LL LLP,1,10 ! Enter a function in cell 120 to calculate the minimum Quartile value in the list of salaries. Use the fill handle to complete the remaining quartile values in cell range 121:124. Be sure to include the appropriate absolute or mixed cell references before copying the functions. 13 Enter a function in cell H27 to calculate the correlation of column D and E. 14 Format the result as Number Format with two decimal positions. 15 If necessary, display the Analysis ToolPak. Run a Data Analysis with descriptive statistics. Complete the input criteria using the salary data in the range D4D53. Set the Output functions to display on a new worksheet Set the output as Summary statistics. 16 Name the newly created worksheet Descriptive Statistics. 12 5 12 3 Created On: 07/28/2020 1 EX16_XL_CH08_GRADER_CAP_AS - Job Satisfaction 1.10 Grader - Instructions Excel 2016 Project Step Instructions Points Possible 17 10 On the Employee Satisfaction worksheet, run a Data Analysis histogram. Use the salaries in the range D4:053 as the input range. Use the quartiles in the range 120:124 as the bin range. Output the data in cell H29. Include a chart with the output. Position Support Staff Sales Rep Accountant Manager Director Summary Information Average Satisfaction $ $ $ $ $ $ Average Salary 3.29 $ 33,538.00 3.60 $ 45,461.00 2.60 $ 66,303.60 3.75 $ 72,829.50 4.25 $ 86,856.50 Directors with > 4 Satisfaction Count 7 Average Salary $ 88,143.71 ID Number Position 1047 Sales Rep 1085 Sales Rep 1102 Sale Rep 1106 Sales Rep 1165 Support Staff 1473 Sales Rep 1486 Support Staff 1503 Support Staff 1519 Sale Rep 1529 Director 1601 Director 1603 Accountant 1675 Sale Rep 1828 Support Staff 2003 Director 2206 Sale Rep 2250 Director 2291 Support Staff 2292 Sales Rep 2416 Director 2528 Manager 2624 Manager 2742 Accountant 3004 Support Staff 3083 Director 3161 Support Staff 2217 Sales Ren Employee Satisfaction Employee Statistics Salary Job Satisfaction Salary Rank 45,855.00 3 46,063.00 4 45,700.00 2 47,572.00 3 3 30,176.00 4 45,993.00 4 32,666.00 1 32,757.00 3 45,674.00 5 88,197.00 5 89,691.00 4 69,389.00 2 2 49,617.00 3 35,230.00 3 83,240.00 5 5 42,383.00 3 92,700.00 4 35,242.00 3 44,854.00 2 77,846.00 3 3 70,125.00 3 73,564.00 5 5 62,263.00 4 30,982.00 2 84,937.00 4 4 32,709.00 4 40 4490 + 27 23 28 22 50 24 45 43 29 4 4 3 3 13 18 38 6 31 2 37 30 8 12 Managers with > 4 Satisfaction Count 2 Average Salary $ 74,165.50 Quartile Salary 0 1 2 3 4 10 Correlation 17 48 5 44 23 3 5 3 5 1 3 5 2 5 3 4 3 3217 Sales Rep 3314 Sales Rep 3338 Support Staff 3402 Support Staff 3473 Support Staff 3638 Sales Rep 3652 Sales Rep 3782 Sale Rep 3808 Support Staff 3818 Sale Rep 3874 Support Staff 3877 Support Staff 3948 Support Staff 3969 Accountant 4239 Support Staff 4243 Support Staff 4269 Accountant 4398 Sales Rep 4541 Manager 4584 Support Staff 4652 Accountant 4771 Manager 4911 Director 4954 Director 40,449.00 45,983.00 36,942.00 33,852.00 33,501.00 48,005.00 48,706.00 45,927.00 31,632.00 49,575.00 34,154.00 34,775.00 37,404.00 65,492.00 32,107.00 35,316.00 68,365.00 41,130.00 72,862.00 30,701.00 66,009.00 74,767.00 81,082.00 97,159.00 33 25 35 41 42 21 20 26 47 19 40 39 34 16 46 36 14 32 11 49 15 9 7 7 1 4 3 4 2 2 4 3 5 2 4 4 5
Step by Step Solution
There are 3 Steps involved in it

Get step-by-step solutions from verified subject matter experts