

Question: Home Due No Due Date Points 0 Submitting an external tool Announcements Modules Assignments Zoom Discussions Grades 2 People Quizzes Chat Part 1 - Attempt
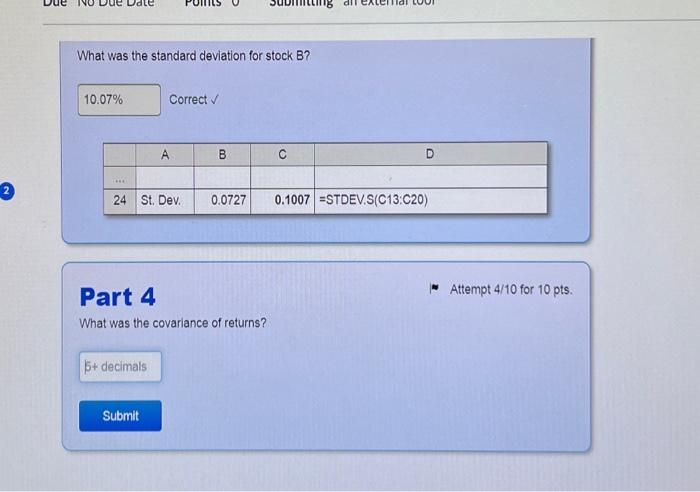
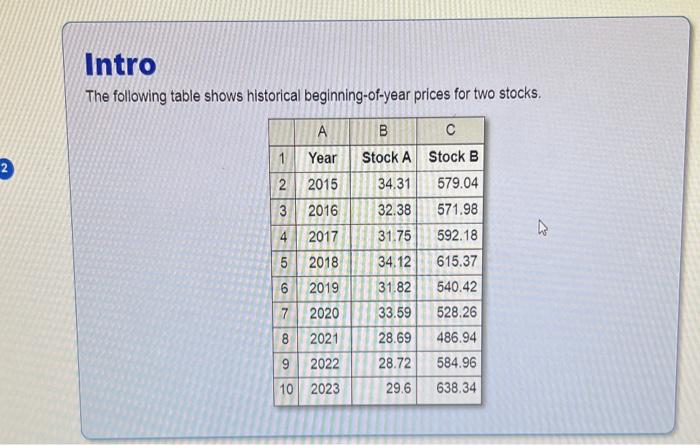
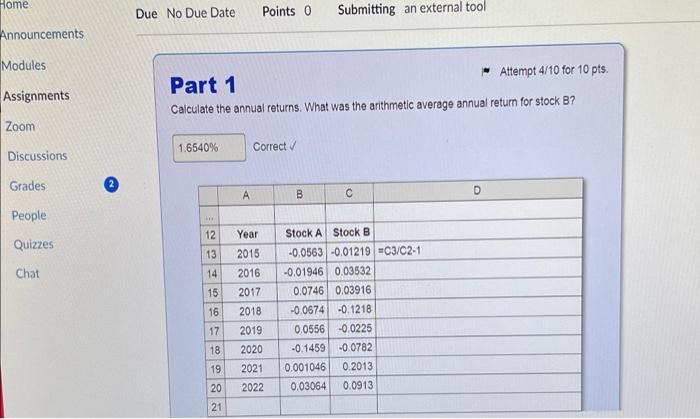
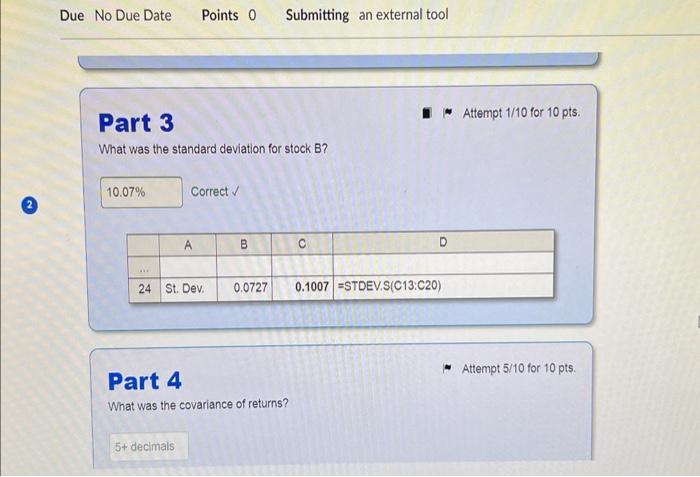
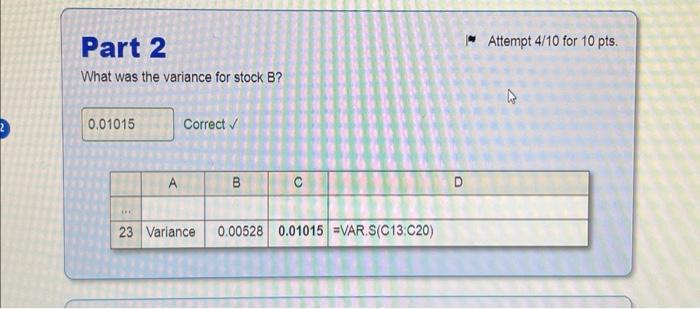
Home Due No Due Date Points 0 Submitting an external tool Announcements Modules Assignments Zoom Discussions Grades 2 People Quizzes Chat Part 1 - Attempt 4/10 for 10 pts. Calculate the annual returns. What was the arithmetic average annual return for stock B? Correct \begin{tabular}{|r|r|r|r|r|} \hline & A & \multicolumn{1}{c|}{B} & \multicolumn{1}{c|}{ C } & \\ \hline & & & & \\ \hline 12 & Year & Stock A & Stock B & \\ \hline 13 & 2015 & -0.0563 & -0.01219 & = C3/C2-1 \\ \hline 14 & 2016 & -0.01946 & 0.03532 & \\ \hline 15 & 2017 & 0.0746 & 0.03916 & \\ \hline 16 & 2018 & -0.0674 & -0.1218 & \\ \hline 17 & 2019 & 0.0556 & -0.0225 & \\ \hline 18 & 2020 & -0.1459 & -0.0782 & \\ \hline 19 & 2021 & 0.001046 & 0.2013 & \\ \hline 20 & 2022 & 0.03064 & 0.0913 & \\ \hline 21 & & & & \\ \hline \end{tabular} Part 3 - Attempt 1/10 for 10 pts. What was the standard deviation for stock B? Correct Part 4 - Attempt 5/10 for 10 pts. What was the covariance of returns? Part 2 - Attempt 4/10 for 10 pts. What was the variance for stock B ? Correct What was the standard deviation for stock B? Correct Part 4 - Attempt 4/10 for 10 pts. What was the covariance of returns? Intro The following table shows historical beginning-of-year prices for two stocks
Step by Step Solution
There are 3 Steps involved in it

Get step-by-step solutions from verified subject matter experts