

Question: Home Insert Draw Page Layout Formulas Data Review Vie Calibri (Body) 12 v ' ' abe v Paste BIU v a. Av F51 fx A
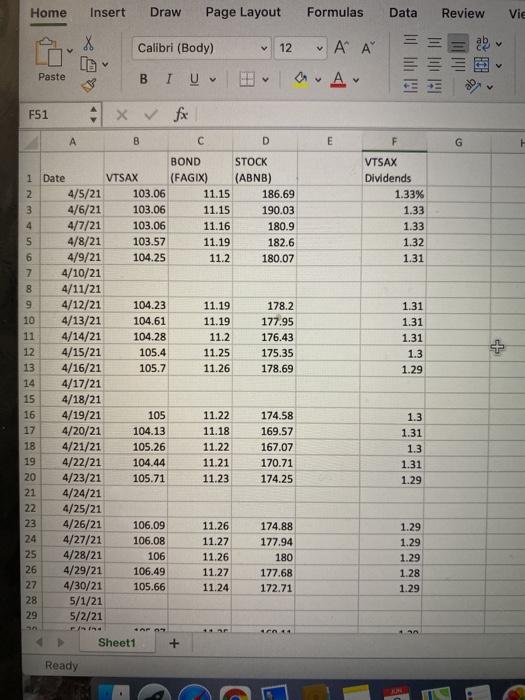
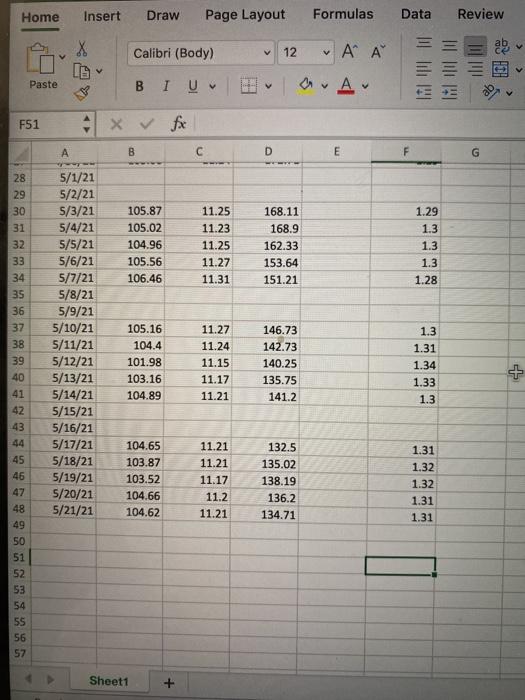
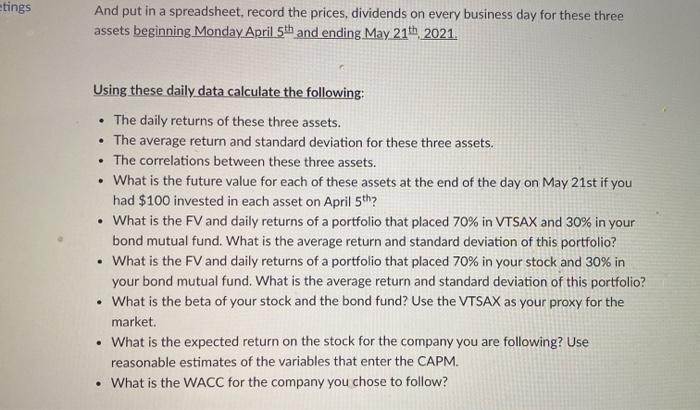
Home Insert Draw Page Layout Formulas Data Review Vie Calibri (Body) 12 v ' ' abe v Paste BIU v a. Av F51 fx A B D E F G 000 won in WNW VTSAX Dividends 1.33% 1.33 1.33 1.32 1.31 1.31 1.31 1.31 1.3 1.29 BOND STOCK 1 Date VTSAX (FAGIX) (ABNB) 4/5/21 103.06 11.15 186.69 3 4/6/21 103.06 11.15 190.03 4 4/7/21 103.06 11.16 180.9 4/8/21 103.57 11.19 182.6 6 4/9/21 104.25 11.2 180.07 4/10/21 8 4/11/21 9 4/12/21 104.23 11.19 178.2 10 4/13/21 104.61 11.19 177.95 11 4/14/21 104.28 11.2 176.43 12 4/15/21 105.4 11.25 175.35 13 4/16/21 105.7 11.26 178.69 14 4/17/21 15 4/18/21 16 4/19/21 105 11.22 174.58 17 4/20/21 104.13 11.18 169.57 18 4/21/21 105.26 11.22 167.07 19 4/22/21 104.44 11.21 170.71 20 4/23/21 105.71 11.23 174.25 21 4/24/21 22 4/25/21 23 4/26/21 106.09 11.26 174.88 24 4/27/21 106.08 11.27 177.94 25 4/28/21 106 11.26 180 26 4/29/21 106.49 11.27 177.68 27 4/30/21 105.66 11.24 172.71 28 5/1/21 29 5/2/21 1.3 1.31 1.3 1.31 1.29 1.29 1.29 1.29 1.28 1.29 Sheet1 + Ready IC Home Insert Draw Page Layout Formulas Data Review Calibri (Body) v 12 v ' ' Paste BIU Av TH F51 x fx A B D E G 1.29 1.3 105.87 105.02 104.96 105.56 106.46 11.25 11.23 11.25 11.27 11.31 168.11 168.9 162.33 153.64 151.21 1.3 1.3 1.28 28 29 30 31 32 33 34 35 36 37 38 39 40 41 42 43 5/1/21 5/2/21 5/3/21 5/4/21 5/5/21 5/6/21 5/7/21 5/8/21 5/9/21 5/10/21 5/11/21 5/12/21 5/13/21 5/14/21 5/15/21 5/16/21 5/17/21 5/18/21 5/19/21 5/20/21 5/21/21 105.16 104.4 101.98 103.16 104.89 11.27 11.24 11.15 11.17 11.21 146.73 142.73 140.25 135.75 141.2 1.3 1.31 1.34 1.33 1.3 + 104.65 103.87 103.52 104.66 104.62 11.21 11.21 11.17 11.2 11.21 132.5 135.02 138.19 136.2 134.71 1.31 1.32 1.32 1.31 1.31 45 46 47 48 49 50 51 52 53 54 55 56 57 Sheet1 + etings And put in a spreadsheet, record the prices, dividends on every business day for these three assets beginning Monday April 5th and ending May 21th 2021. . Using these daily data calculate the following: The daily returns of these three assets. The average return and standard deviation for these three assets. The correlations between these three assets. What is the future value for each of these assets at the end of the day on May 21st if you had $100 invested in each asset on April 5th? What is the FV and daily returns of a portfolio that placed 70% in VTSAX and 30% in your bond mutual fund. What is the average return and standard deviation of this portfolio? What is the FV and daily returns of a portfolio that placed 70% in your stock and 30% in your bond mutual fund. What is the average return and standard deviation of this portfolio? What is the beta of your stock and the bond fund? Use the VTSAX as your proxy for the market What is the expected return on the stock for the company you are following? Use reasonable estimates of the variables that enter the CAPM. What is the WACC for the company you chose to follow? Home Insert Draw Page Layout Formulas Data Review Vie Calibri (Body) 12 v ' ' abe v Paste BIU v a. Av F51 fx A B D E F G 000 won in WNW VTSAX Dividends 1.33% 1.33 1.33 1.32 1.31 1.31 1.31 1.31 1.3 1.29 BOND STOCK 1 Date VTSAX (FAGIX) (ABNB) 4/5/21 103.06 11.15 186.69 3 4/6/21 103.06 11.15 190.03 4 4/7/21 103.06 11.16 180.9 4/8/21 103.57 11.19 182.6 6 4/9/21 104.25 11.2 180.07 4/10/21 8 4/11/21 9 4/12/21 104.23 11.19 178.2 10 4/13/21 104.61 11.19 177.95 11 4/14/21 104.28 11.2 176.43 12 4/15/21 105.4 11.25 175.35 13 4/16/21 105.7 11.26 178.69 14 4/17/21 15 4/18/21 16 4/19/21 105 11.22 174.58 17 4/20/21 104.13 11.18 169.57 18 4/21/21 105.26 11.22 167.07 19 4/22/21 104.44 11.21 170.71 20 4/23/21 105.71 11.23 174.25 21 4/24/21 22 4/25/21 23 4/26/21 106.09 11.26 174.88 24 4/27/21 106.08 11.27 177.94 25 4/28/21 106 11.26 180 26 4/29/21 106.49 11.27 177.68 27 4/30/21 105.66 11.24 172.71 28 5/1/21 29 5/2/21 1.3 1.31 1.3 1.31 1.29 1.29 1.29 1.29 1.28 1.29 Sheet1 + Ready IC Home Insert Draw Page Layout Formulas Data Review Calibri (Body) v 12 v ' ' Paste BIU Av TH F51 x fx A B D E G 1.29 1.3 105.87 105.02 104.96 105.56 106.46 11.25 11.23 11.25 11.27 11.31 168.11 168.9 162.33 153.64 151.21 1.3 1.3 1.28 28 29 30 31 32 33 34 35 36 37 38 39 40 41 42 43 5/1/21 5/2/21 5/3/21 5/4/21 5/5/21 5/6/21 5/7/21 5/8/21 5/9/21 5/10/21 5/11/21 5/12/21 5/13/21 5/14/21 5/15/21 5/16/21 5/17/21 5/18/21 5/19/21 5/20/21 5/21/21 105.16 104.4 101.98 103.16 104.89 11.27 11.24 11.15 11.17 11.21 146.73 142.73 140.25 135.75 141.2 1.3 1.31 1.34 1.33 1.3 + 104.65 103.87 103.52 104.66 104.62 11.21 11.21 11.17 11.2 11.21 132.5 135.02 138.19 136.2 134.71 1.31 1.32 1.32 1.31 1.31 45 46 47 48 49 50 51 52 53 54 55 56 57 Sheet1 + etings And put in a spreadsheet, record the prices, dividends on every business day for these three assets beginning Monday April 5th and ending May 21th 2021. . Using these daily data calculate the following: The daily returns of these three assets. The average return and standard deviation for these three assets. The correlations between these three assets. What is the future value for each of these assets at the end of the day on May 21st if you had $100 invested in each asset on April 5th? What is the FV and daily returns of a portfolio that placed 70% in VTSAX and 30% in your bond mutual fund. What is the average return and standard deviation of this portfolio? What is the FV and daily returns of a portfolio that placed 70% in your stock and 30% in your bond mutual fund. What is the average return and standard deviation of this portfolio? What is the beta of your stock and the bond fund? Use the VTSAX as your proxy for the market What is the expected return on the stock for the company you are following? Use reasonable estimates of the variables that enter the CAPM. What is the WACC for the company you chose to follow
Step by Step Solution
There are 3 Steps involved in it

Get step-by-step solutions from verified subject matter experts