

Question: Home Insert Draw Page Layout Formulas Data Review Vien Help Tell me what you want to do Calibri - 114 A Xcut Da Copy .
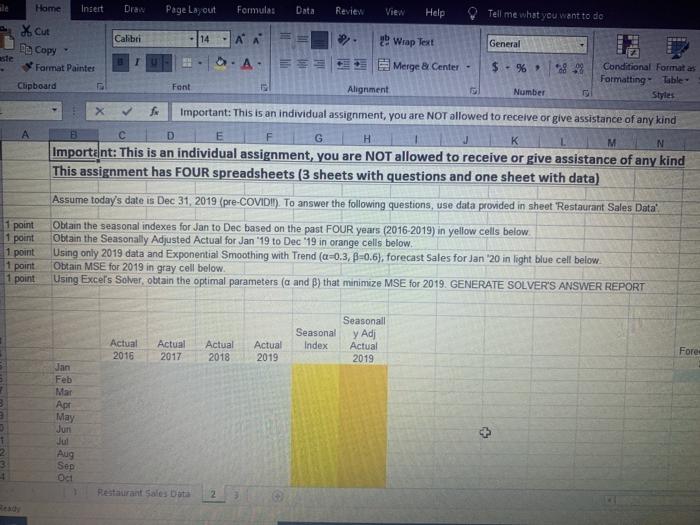
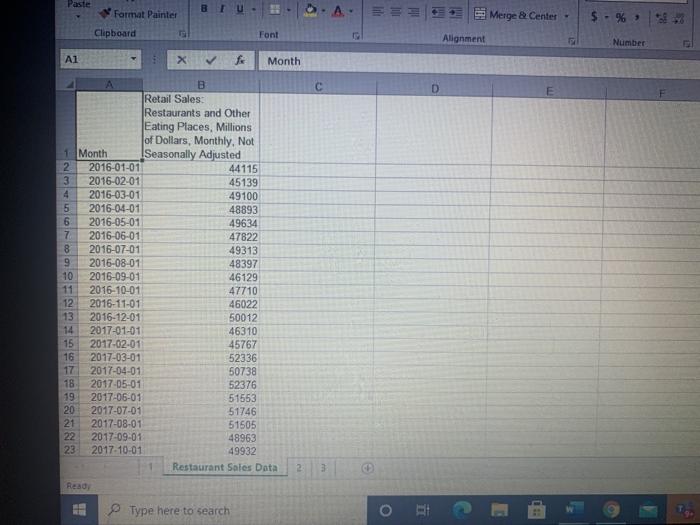
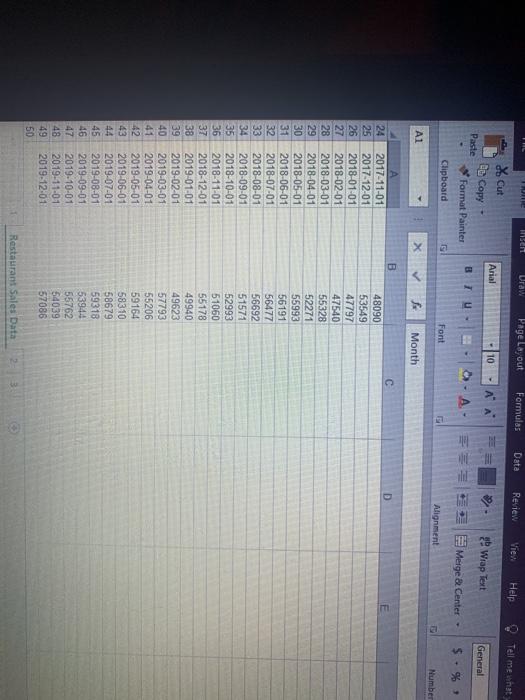
Home Insert Draw Page Layout Formulas Data Review Vien Help Tell me what you want to do Calibri - 114 A Xcut Da Copy . Format Paintes General ste 2 Wrap Text Merge Center - 1 $ - % Conditional Formatas Formatting-table- Styles Clipboard Font Alignment Number B D G K N Important: This is an individual assignment, you are NOT allowed to receive or give assistance of any kind E M Important: This is an individual assignment, you are NOT allowed to receive or give assistance of any kind This assignment has FOUR spreadsheets (3 sheets with questions and one sheet with data) Assume today's date is Dec 31, 2019 (pre-COVIDII). To answer the following questions, use data provided in sheet Restaurant Sales Data Obtain the seasonal indexes for Jan to Dec based on the past FOUR years (2016-2019) in yellow cells Obtain the Seasonally Adjusted Actual for Jan 19 to Dec 19 in orange cells below. Using only 2019 data and Exponential Smoothing with Trend (a=0.3, B=0.6), forecast Sales for Jan '20 in light blue cell below Obtain MSE for 2019 in gray cell below. Using Excel's Solver, obtain the optimal parameters (a and B) that minimize MSE for 2019. GENERATE SOLVER'S ANSWER REPORT elow 1 point 1 point 1 point 1 point 1 point Actual 2016 Actual 2017 Seasonal Index Actual 2018 Seasonall y Ad Actual 2019 Actual 2019 Fore Jan Feb Mar Apr May Jun Jul Aug Sep 4 Restaurant Sales Data 2 Paste BI Format Painter A HUB Merge & Center 5 - %* Clipboard Font Alignment Number Al Month D E A B Retail Sales Restaurants and Other Eating Places, Millions of Dollars, Monthly. Not 1 Month Seasonally Adjusted 2 2016-01-01 44115 3 2016-02-01 45139 4 2016-03-01 49100 5 2016-04-01 48893 6 2016-05-01 49634 7 2016-06-01 47822 8 2016-07-01 49313 9 2016-08-01 48397 10 2016-09-01 46129 11 2016-10-01 47710 12 2016-11-01 46022 13 2016-12-01 50012 14 2017-01-01 46310 15 2017-02-01 45767 16 2017-03-01 52336 17 2017-04-01 50738 18 2017-05-01 52376 19 2017-06-01 51553 20 2017-07-01 51746 21 2017-08-01 51505 22 2017-09-01 48963 23 2017-10-01 49932 Restaurant Sales Data 2 3 Read Type here to search Uraw Page Layout Formulas Data Review View Help Tell me what Arial -10 * Cut Be Copy - Paste Format Painter AA General BIU A Wrap Text Meige Center - $. % Clipboard Font Alignment Number 1 Month B c D E 24 25 26 27 28 29 30 31 32 33 34 35 36 37 38 39 40 41 42 43 44 45 46 47 48 49 50 2017-11-01 2017-12-01 2018-01-01 2018-02-01 2018-03-01 2018-04-01 2018-05-01 2018-06-01 2018-07-01 2018-08-01 2018-09-01 2018-10-01 2018-11-01 2018-12-01 2019-01-01 2019-02-01 2019-03-01 2019-04-01 2019-05-01 2019-06-01 2019-07-01 2019-08-01 2019-09-01 2019-10-01 2019-11-01 2019-12-01 48090 53549 47797 47540 55328 52271 55993 56191 56477 56692 51574 52993 51060 55178 49940 49623 57793 55206 59164 58310 58679 59318 53944 55762 54039 57086 Restaurant Sales Data Home Insert Draw Page Layout Formulas Data Review Vien Help Tell me what you want to do Calibri - 114 A Xcut Da Copy . Format Paintes General ste 2 Wrap Text Merge Center - 1 $ - % Conditional Formatas Formatting-table- Styles Clipboard Font Alignment Number B D G K N Important: This is an individual assignment, you are NOT allowed to receive or give assistance of any kind E M Important: This is an individual assignment, you are NOT allowed to receive or give assistance of any kind This assignment has FOUR spreadsheets (3 sheets with questions and one sheet with data) Assume today's date is Dec 31, 2019 (pre-COVIDII). To answer the following questions, use data provided in sheet Restaurant Sales Data Obtain the seasonal indexes for Jan to Dec based on the past FOUR years (2016-2019) in yellow cells Obtain the Seasonally Adjusted Actual for Jan 19 to Dec 19 in orange cells below. Using only 2019 data and Exponential Smoothing with Trend (a=0.3, B=0.6), forecast Sales for Jan '20 in light blue cell below Obtain MSE for 2019 in gray cell below. Using Excel's Solver, obtain the optimal parameters (a and B) that minimize MSE for 2019. GENERATE SOLVER'S ANSWER REPORT elow 1 point 1 point 1 point 1 point 1 point Actual 2016 Actual 2017 Seasonal Index Actual 2018 Seasonall y Ad Actual 2019 Actual 2019 Fore Jan Feb Mar Apr May Jun Jul Aug Sep 4 Restaurant Sales Data 2 Paste BI Format Painter A HUB Merge & Center 5 - %* Clipboard Font Alignment Number Al Month D E A B Retail Sales Restaurants and Other Eating Places, Millions of Dollars, Monthly. Not 1 Month Seasonally Adjusted 2 2016-01-01 44115 3 2016-02-01 45139 4 2016-03-01 49100 5 2016-04-01 48893 6 2016-05-01 49634 7 2016-06-01 47822 8 2016-07-01 49313 9 2016-08-01 48397 10 2016-09-01 46129 11 2016-10-01 47710 12 2016-11-01 46022 13 2016-12-01 50012 14 2017-01-01 46310 15 2017-02-01 45767 16 2017-03-01 52336 17 2017-04-01 50738 18 2017-05-01 52376 19 2017-06-01 51553 20 2017-07-01 51746 21 2017-08-01 51505 22 2017-09-01 48963 23 2017-10-01 49932 Restaurant Sales Data 2 3 Read Type here to search Uraw Page Layout Formulas Data Review View Help Tell me what Arial -10 * Cut Be Copy - Paste Format Painter AA General BIU A Wrap Text Meige Center - $. % Clipboard Font Alignment Number 1 Month B c D E 24 25 26 27 28 29 30 31 32 33 34 35 36 37 38 39 40 41 42 43 44 45 46 47 48 49 50 2017-11-01 2017-12-01 2018-01-01 2018-02-01 2018-03-01 2018-04-01 2018-05-01 2018-06-01 2018-07-01 2018-08-01 2018-09-01 2018-10-01 2018-11-01 2018-12-01 2019-01-01 2019-02-01 2019-03-01 2019-04-01 2019-05-01 2019-06-01 2019-07-01 2019-08-01 2019-09-01 2019-10-01 2019-11-01 2019-12-01 48090 53549 47797 47540 55328 52271 55993 56191 56477 56692 51574 52993 51060 55178 49940 49623 57793 55206 59164 58310 58679 59318 53944 55762 54039 57086 Restaurant Sales Data
Step by Step Solution
There are 3 Steps involved in it

Get step-by-step solutions from verified subject matter experts