Question: Home Insert Page Layout Formulas HeVIEW VIEW Automate Help 11 A A E Number EX - Paste B E E = Conditional Format and Call
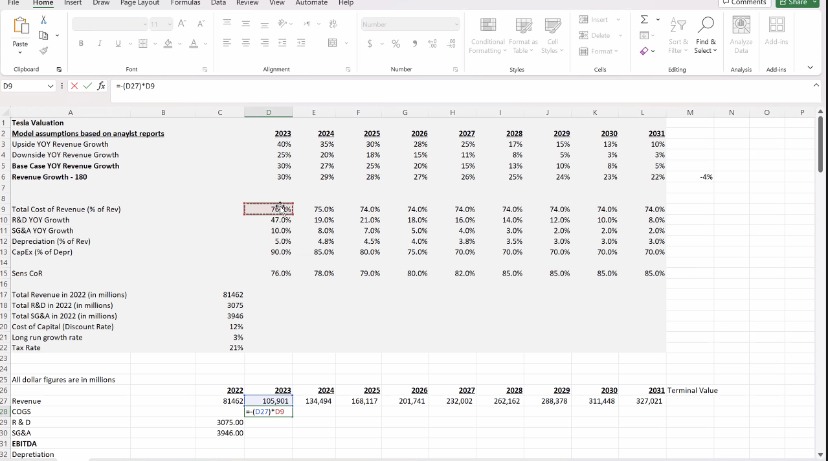
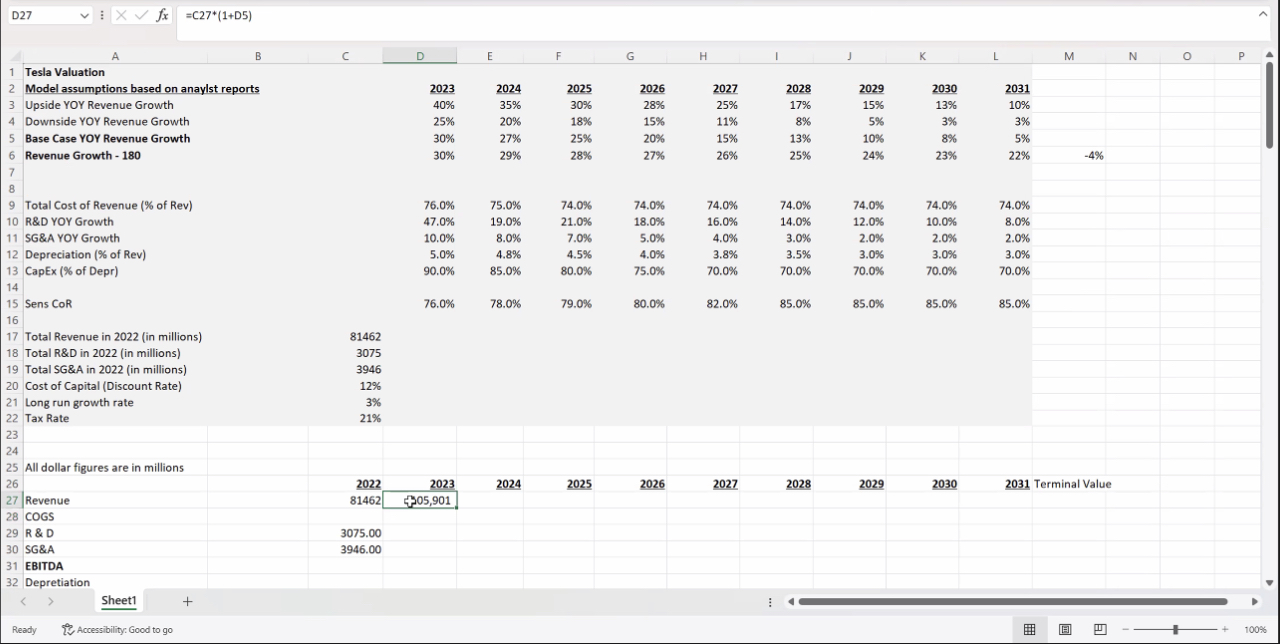
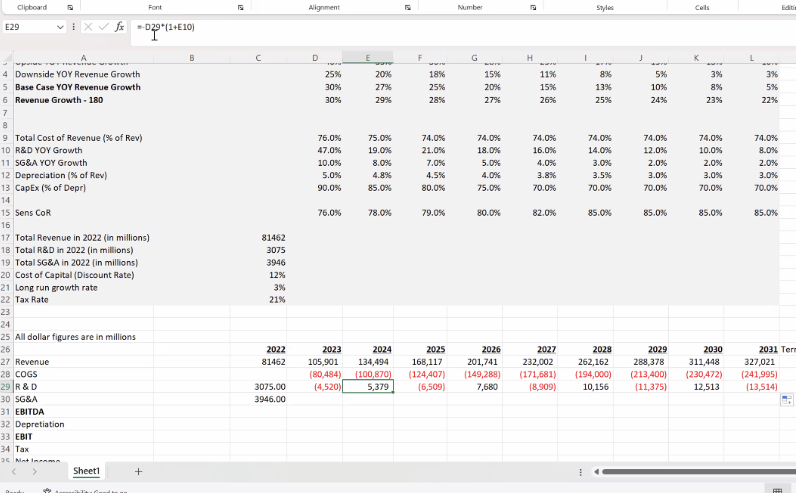
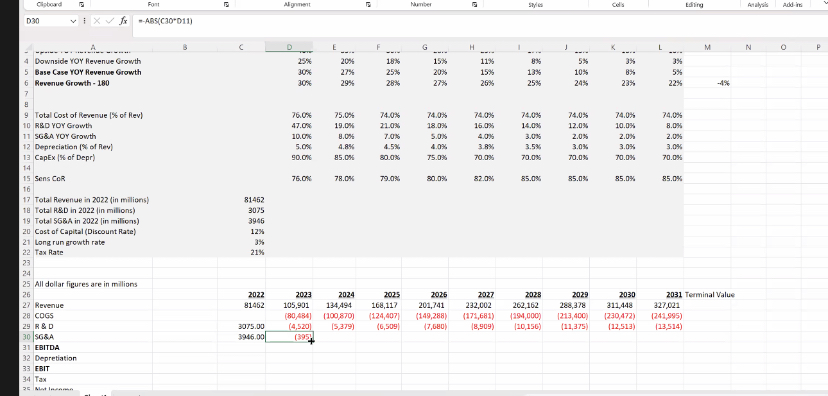
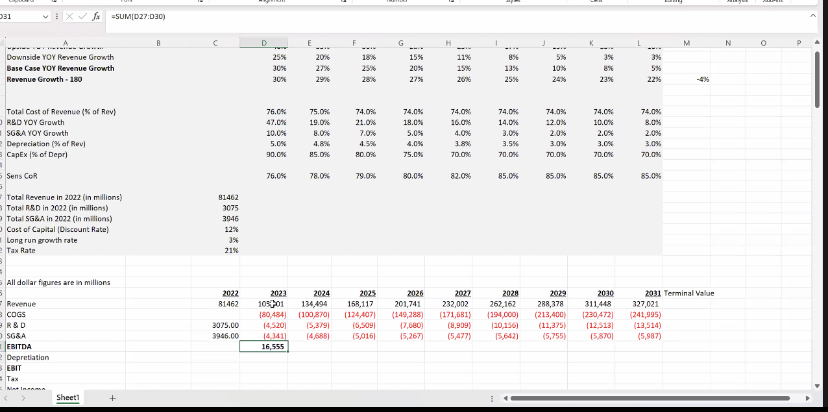
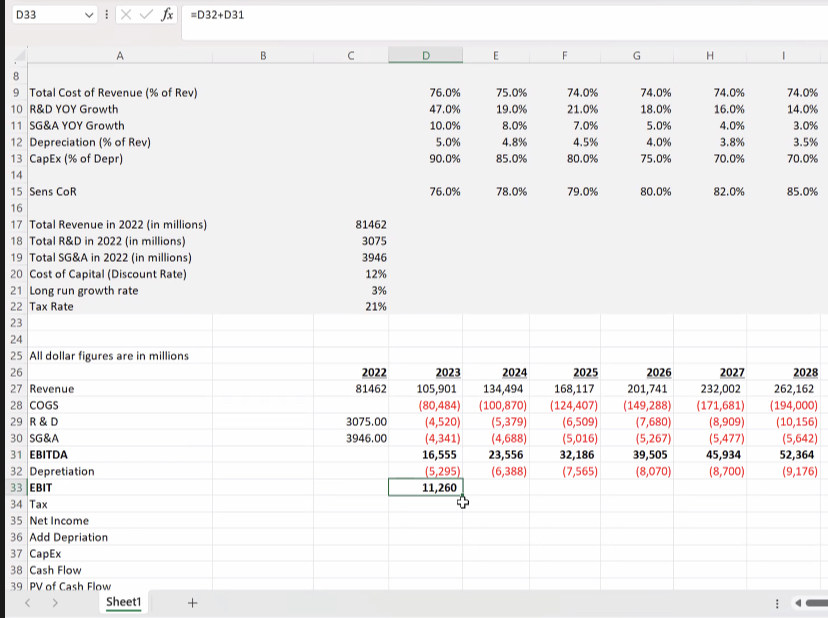
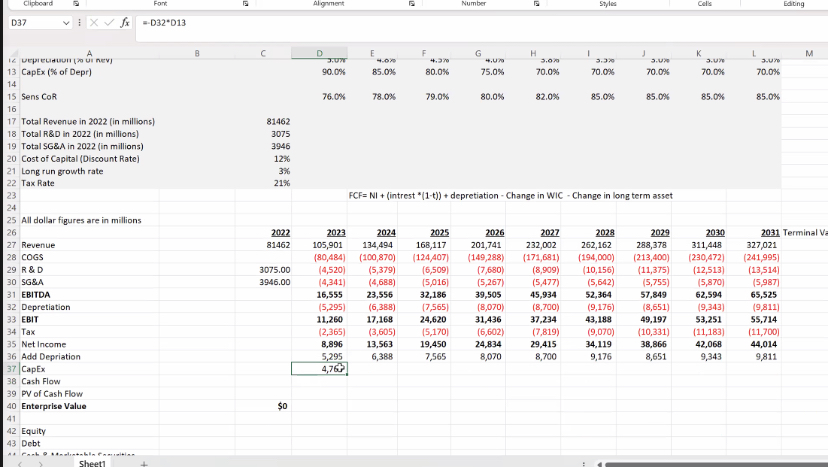
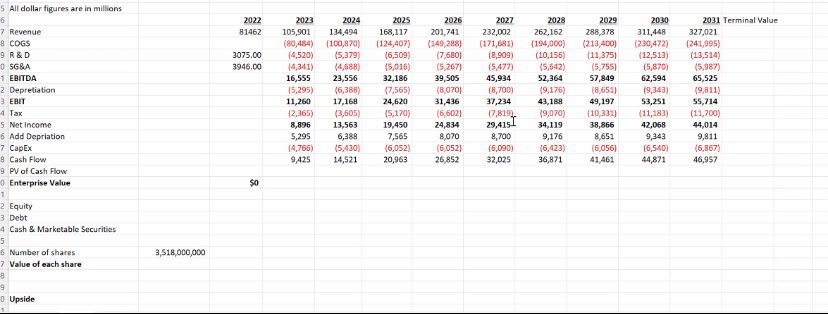
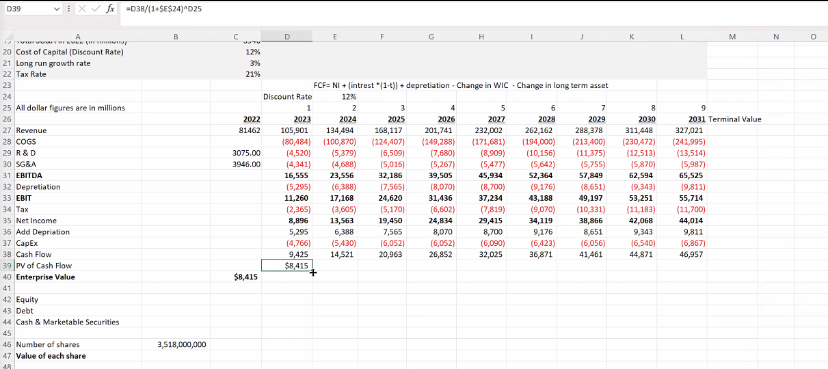
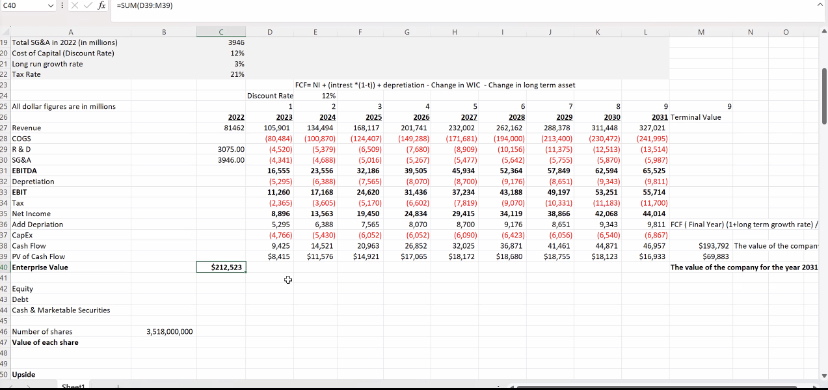
Home Insert Page Layout Formulas HeVIEW VIEW Automate Help 11 A A E Number EX - Paste B E E = Conditional Format and Call Son & Find & Analyza Add-im Formatting - Tablo Styles Format ~ File * Salad Data Clipboard Fort Alignment Number vixx =(027]*09 B C D E F G H K L M IN P Tesla Valuation Model assumptions based on anaylst reports 2023 2024 2025 2026 2027 2028 2025 2030 2031 Upside YOY Revenue Growth 40% 35% 28% 25% 17% 159% 13% 10% Downside YOY Revenue Growth 25% 20% 18% 159 11%% Base Case YOY Revenue Growth 30% 27% 25%% 204 15% 13% 10% 8% Revenue Growth - 180 30% 20% 28% 27% 25% 25% 23% 9 Total Cost of Revenue (M of Rev) 74.0% 74.0% 74,01 740% 74.0% 74.016 10 R&D YOY Growth 19.0% 21.0% 18.0% 16.0% 14.0% 12.0%% 10.0% 11 SG&A YOY Growth 10.0% 8.0% 5.0% 3.04 2.0% 12 Depreciation (* of Rev) 4.5% 4.0%% 3.54 2.0.6 3.0% 13 CapEx [ of Depr] 90 0% 85.0% 75,04 70 0% 70,0% 70 0% 70,0% 70 0% 14 Sens COR 76.0%% 79.0% 85.0% 85.0% 85.01 16 Total Revenue in 2022 (in milliori) 81452 18 Total R&D in 2022 (in millions) SCDE 19 Total SG&A in 2022 (in millions) 3946 10 Cost of Capital [ Discount Rate] 1 Long run growth rate 22 Tax Rate 25 All dollar figures are in millions 2022 2023 2024 2025 2020 2027 2028 2029 2030 2081 Terminal Value 27 Revenue B14521 105,901 104,494 168,117 201 741 202,002 262,162 268,378 311 448 327,021 B COGS (D27) . DO 29 R & D 3075.00 30 SGEA 3946.00 31 EBITDA 12 Depreciation\fClipboard Font Alignment Number Styles Cells E29 viXV f =D29*(1+[10) B C D E F G H K L Downside YOY Revenue Growth 25% 20% 18% 15% 115% 3%% 3%% Base Case YOY Revenue Growth 30% 27% 25% 209 15% 139 10%% Revenue Growth - 180 30% 2:9% 28% 279% 26% 259% 24% 239 22%% Total Cost of Revenue ( of Rev) 76.09% 75.096 74.0% 74.0% 74.0% 74.096 74.0% 74.0% 74.0% 10 R&D YOY Growth 47.0% 19.0% 21.0% 18.0%6 16.0% 14.0% 12.0%6 10.0% 8.0% 11 5G&A YOY Growth 10.0% 8.09% 7.0% 5.0% 4.0% 3.096 2.0% 2.0% 2.0%% 12 Depreciation (% of Rev) 5.0% 4.895 4.5% 3.8%6 3.5% 3.0%% 3.0% 3.0% 13 CapEx (% of Depr] 90.0% 85.09% 80,0% 75.0% 70.0% 70.09% 70.0% 70,0% 70.0% 14 Sens COR 76.0% 78.0% 79.0% 80.0% 82.0% 85.0% 85.0% 85.0% 85.0% 17 Total Revenue in 2022 (in millions) 81462 18 Total R&D in 2022 (in millions) 3075 19 Total SG&A in 2022 [in millions) 3946 20 Cost of Capital (Discount Rate) 12% 21 Long run growth rate 3% 22 Tax Rate 21% 23 24 25 All dollar figures are in millions 26 2022 2023 2024 2025 2026 2027 2028 2029 DEOZ 2031 Ter 27 Revenue 81462 105,901 134,494 168,117 201,741 232,002 262,162 288,378 311,448 327,021 28 COGS (80,484) [100,870) (124,407) [149,288] (171,681) [194,000) (213,400] (230,472) (241,995] 25 R & D 3075.00 (4.520 5,379 (6,509) 7,680 (8,909) 10,156 [11,375] 12,513 (13,514] 30 SG&A 3946.00 31 EBITDA 32 Depretiation 33 EBIT 34 Tax Sheet1 +Fant Number Add-in -ABS(C30*D11) C D E F G H J L M Downside YOY Revenue Growth 25% 20% 10% 15% 11% 5% Base Case TOY Revenue Growth JO% 27% 25% 20% 15%% 10% 5% Revenue Growth - 180 29% 28% 25% 25% 24% 22% Total Cost of Revenue [ of Rev) 76.0% 75.0%% 74.0% 74.0%% 74.019 74.0% 74.0% 74.0%% 10 RED YOY Growth 47.08 19.04 18.0% 16.0% 14.0%6 12.0% 10.03 11 SG&A YOY Growth 10.0% TOK 3.0% 2.0% 2.0 2.04 12 Depreciation [ of Rev) 4.AK 4.5% 3.RM 3.5% 3.0% 3.0% 3.04 13 CapEx ($ of Depr 85.04 80.0% 75.09% 70.09% 70.09 70.036 70.0% 70.08 14 15 Sens COR 76.0% 78.046 80.0% 82.0% 85.0% 85.0% 85.0% 85.0% 16 17 Total Revenue in 2022 (in millions) 81452 18 Total R&D in 2022 (in millions) 3075 19 Total 568A in 2022 [in millions) 3045 20 Cost of Capital (Discount Rate) 21 Long run growth rate 22 Tax Rate 21X 23 24 25 All dollar figures are in millions 26 2022 2023 2024 2025 2025 2027 2028 2029 2030 2031 Terminal Value 27 Revenue 81462 105,901 134,494 168,117 201,741 ZOO'ZEZ 262,162 288,378 211,448 327 021 28 COGS (80,#84] [100,870) (124,407) (149,288) (171,681) (154,000) |213,400) (230,472) (741,995) 29 R & D 3075.D0 (4,520] [5,379) (6,509) 17,G80) (8,909) (10,156) (11,375) (12,513) (13,514) 30 5GEA 3946.00 (395) 31 EBITDA 32 Depretiation 33 EBIT 34 Tax(DEO: