

Question: Home / My courses / COMM-225-2231-EC / Midterm 2 / Midterm 2 (Summer 2023) Question 20 Not yet answered Marked out of 2.00 Flag question
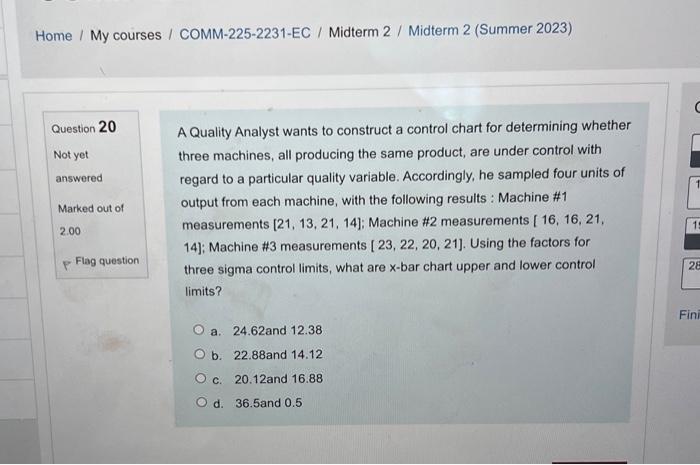
Home / My courses / COMM-225-2231-EC / Midterm 2 / Midterm 2 (Summer 2023) Question 20 Not yet answered Marked out of 2.00 Flag question A Quality Analyst wants to construct a control chart for determining whether three machines, all producing the same product, are under control with regard to a particular quality variable. Accordingly, he sampled four units of output from each machine, with the following results : Machine \#1 measurements [21, 13, 21, 14]; Machine \#2 measurements [ 16,16,21, 14]; Machine \#3 measurements [ 23, 22, 20, 21]. Using the factors for three sigma control limits, what are x-bar chart upper and lower control limits? a. 24.62 and 12.38 b. 22.88 and 14.12 c. 20.12 and 16.88 d. 36.5 and 0.5
Step by Step Solution
There are 3 Steps involved in it

Get step-by-step solutions from verified subject matter experts