

Question: Home Tools Assignment 1.pdf... x (? H T 6 1 6 + 169% X (d) Based on median and the mean, what can you conclude
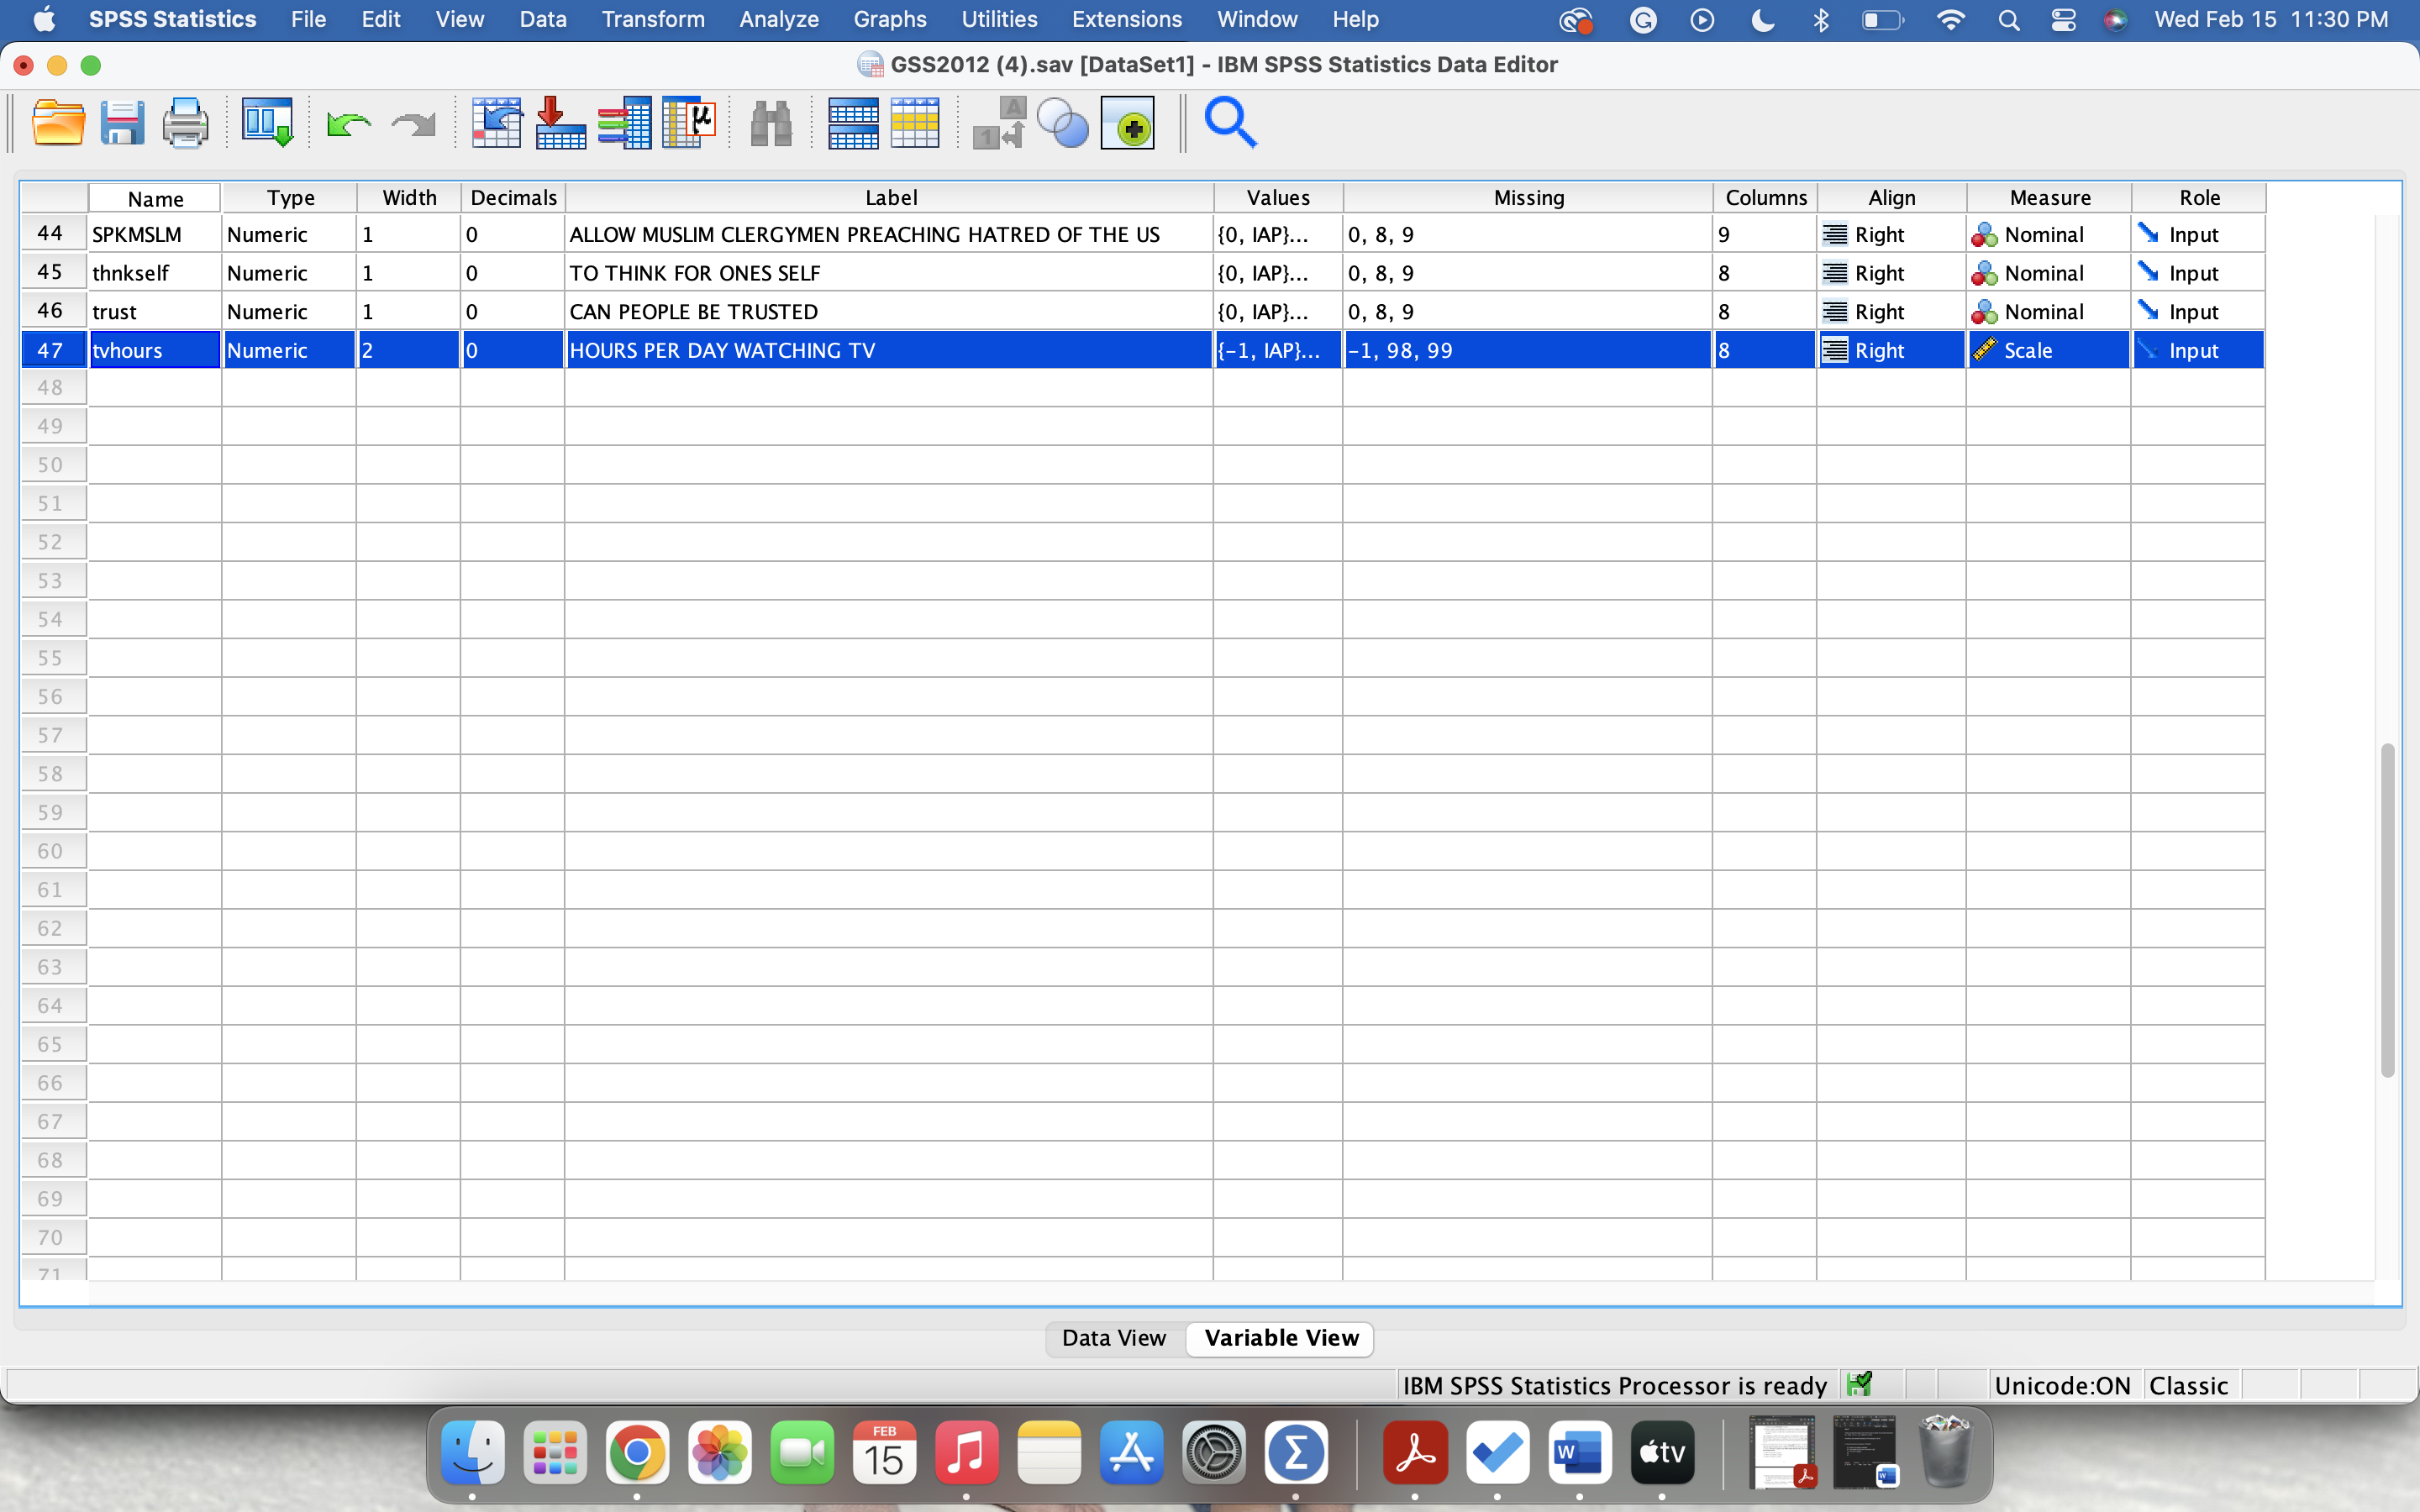
Home Tools Assignment 1.pdf... x (? H T 6 1 6 + 169% X (d) Based on median and the mean, what can you conclude about the overall shape of the distribution? Specifically, is it skewed? If so, in which direction? What does the skewness (if any) of the distribution tell us about patterns of TV watching? (5 points) Co (e) Interpret the frequency distribution. Substantively, do any values seem EO particularly high or low? Why? (6 points) LaSPSS Statistics File Edit View Data Transform Analyze Graphs Utilities Extensions Window Help GOC $ 7 9 8 Wed Feb 15 11:30 PM GSS2012 (4).sav [DataSet1] - IBM SPSS Statistics Data Editor F + Name Type Width Decimals Label Values Missing Columns Align Measure Role 44 SPKMSLM Numeric 1 0 ALLOW MUSLIM CLERGYMEN PREACHING HATRED OF THE US {0, IAP}... 0, 8, 9 9 Right Nominal Input 45 thnkself Numeric 1 0 TO THINK FOR ONES SELF [0, IAP}... 0, 8, 9 00 Right Nominal Input 46 trust Numeric 1 CAN PEOPLE BE TRUSTED (0, IAP}... 0 , 8, 9 Right Nomina Input 47 tvhours Numeric 2 HOURS PER DAY WATCHING TV {-1, IAP}... -1, 98, 99 B Right Scale Input 48 49 50 51 52 53 54 55 56 57 58 59 60 61 62 63 64 65 66 67 68 69 70 71 Data View Variable View IBM SPSS Statistics Processor is ready . Unicode:ON Classic FEB 15 4 & w tv
Step by Step Solution
There are 3 Steps involved in it

Get step-by-step solutions from verified subject matter experts