

Question: home work Using your favorite statistics software package, you generate a scatter plot which displays a linear form. You find a regression equation and the
home work
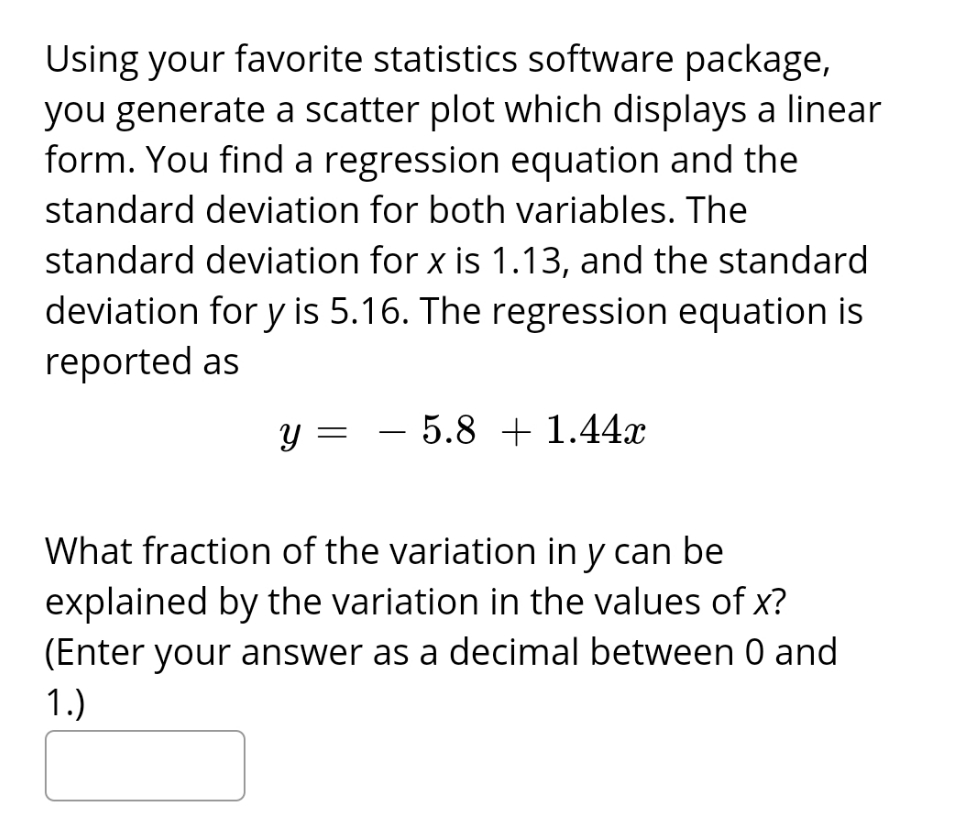
Using your favorite statistics software package, you generate a scatter plot which displays a linear form. You find a regression equation and the standard deviation for both variables. The standard deviation for x is 1.13, and the standard deviation for y is 5.16. The regression equation is reported as y = - 5.8 + 1.44x What fraction of the variation in y can be explained by the variation in the values of x? (Enter your answer as a decimal between 0 and 1.)
Step by Step Solution
There are 3 Steps involved in it
1 Expert Approved Answer
Step: 1 Unlock

Question Has Been Solved by an Expert!
Get step-by-step solutions from verified subject matter experts
Step: 2 Unlock
Step: 3 Unlock