

Question: Homework 14 Chapter 12 Correlation 1. For the following set of data: X Y 1 O 2 2 4 6 5 8 3 4 Sketch
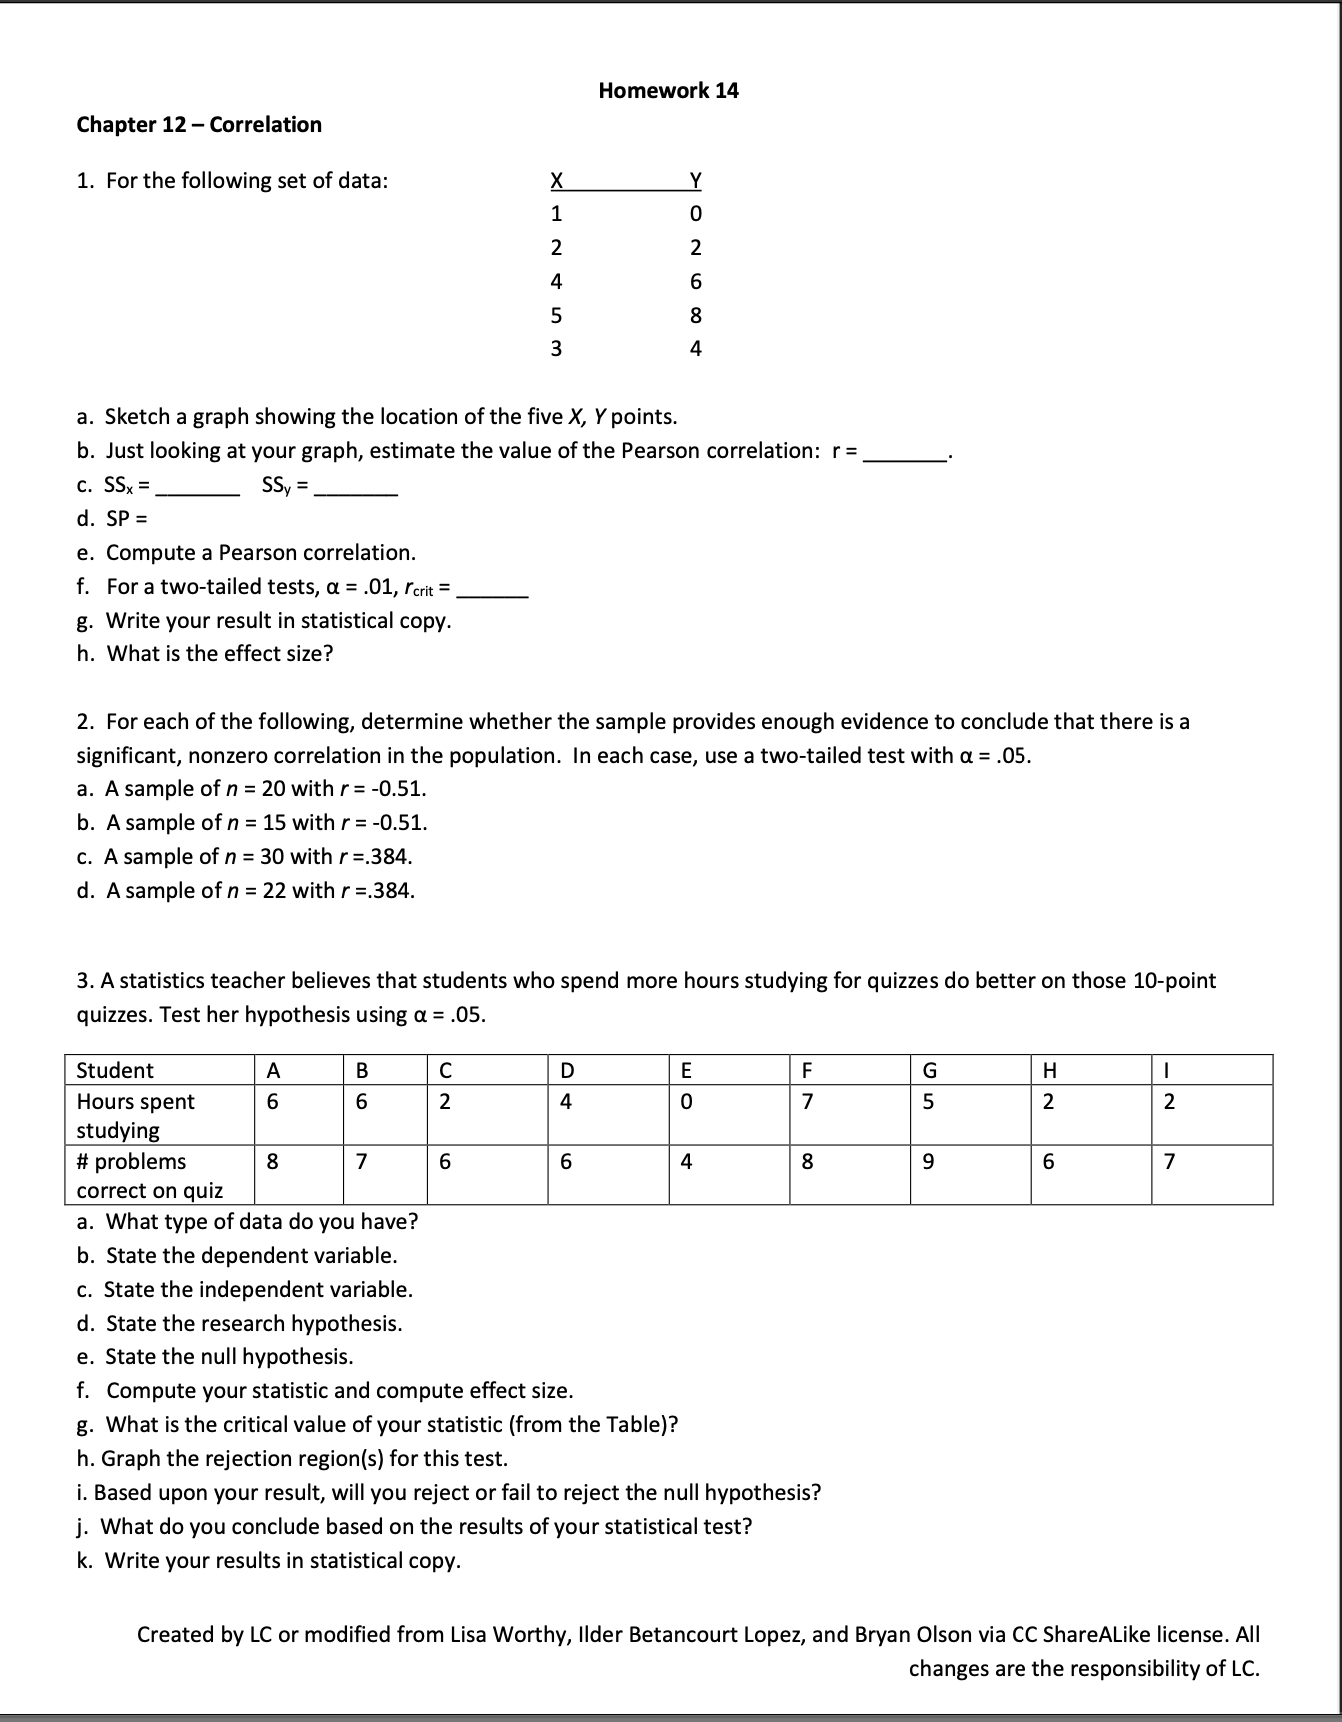
Homework 14 Chapter 12 Correlation 1. For the following set of data: X Y 1 O 2 2 4 6 5 8 3 4 Sketch a graph showing the location of the five X, Ypoints. . Just looking at your graph, estimate the value of the Pearson correlation: r = $5,. = $3, = SP = Compute 3 Pearson correlation. For a two-tailed tests, a = .01, rm = Write your result in statistical copy. . What is the effect size? :quwpgpo-gn 2. For each of the following, determine whether the sample provides enough evidence to conclude that there is a signicant, nonzero correlation in the population. In each case, use a two-tailed test with a = .05. a. A sample of n = 20 with r= -0.51. b. A sample of n = 15 with r = -0.51. c. A sample of n = 30 with r =.384. d. A sample of n = 22 with r =.384. 3. A statistics teacher believes that students who spend more hours studying for quizzes do better on those 10-point quizzes. Test her hypothesis using :1 = .05. Student A B C D E F G H l Hours spent 6 6 2 4 0 7 5 2 2 studying # problems 8 7 6 6 4 8 9 5 7 correct on quiz a. What type of data do you have? b. State the dependent variable. c. State the independent variable. d. State the research hypothesis. e. State the null hypothesis. f. Compute your statistic and compute effect size. g. What is the critical value of your statistic (from the Table)? h. Graph the rejection region(s) for this test. i. Based upon your result, will you reject or fail to reject the null hypothesis? j. What do you conclude based on the results of your statistical test? k. Write your results in statistical copy. Created by LC or modied from Lisa Worthy, Ilder Betancourt Lopez, and Bryan Olson via CC ShareALike license. All changes are the responsibility of LC
Step by Step Solution
There are 3 Steps involved in it

Get step-by-step solutions from verified subject matter experts