

Question: Homework 3 DA 6233 Homework (https://rpubs.com/malshe/homework3) R Coding Q1 (3 points) Use mpg data set from ggplot2 to produce a static visualization and then use

Homework 3
DA 6233
Homework (https://rpubs.com/malshe/homework3)
R Coding
Q1 (3 points)
Use mpg data set from ggplot2 to produce a static visualization and then use ggplotly() to produce a limited interactive plot.
Hint: You will need to supply only frame. No ids used.
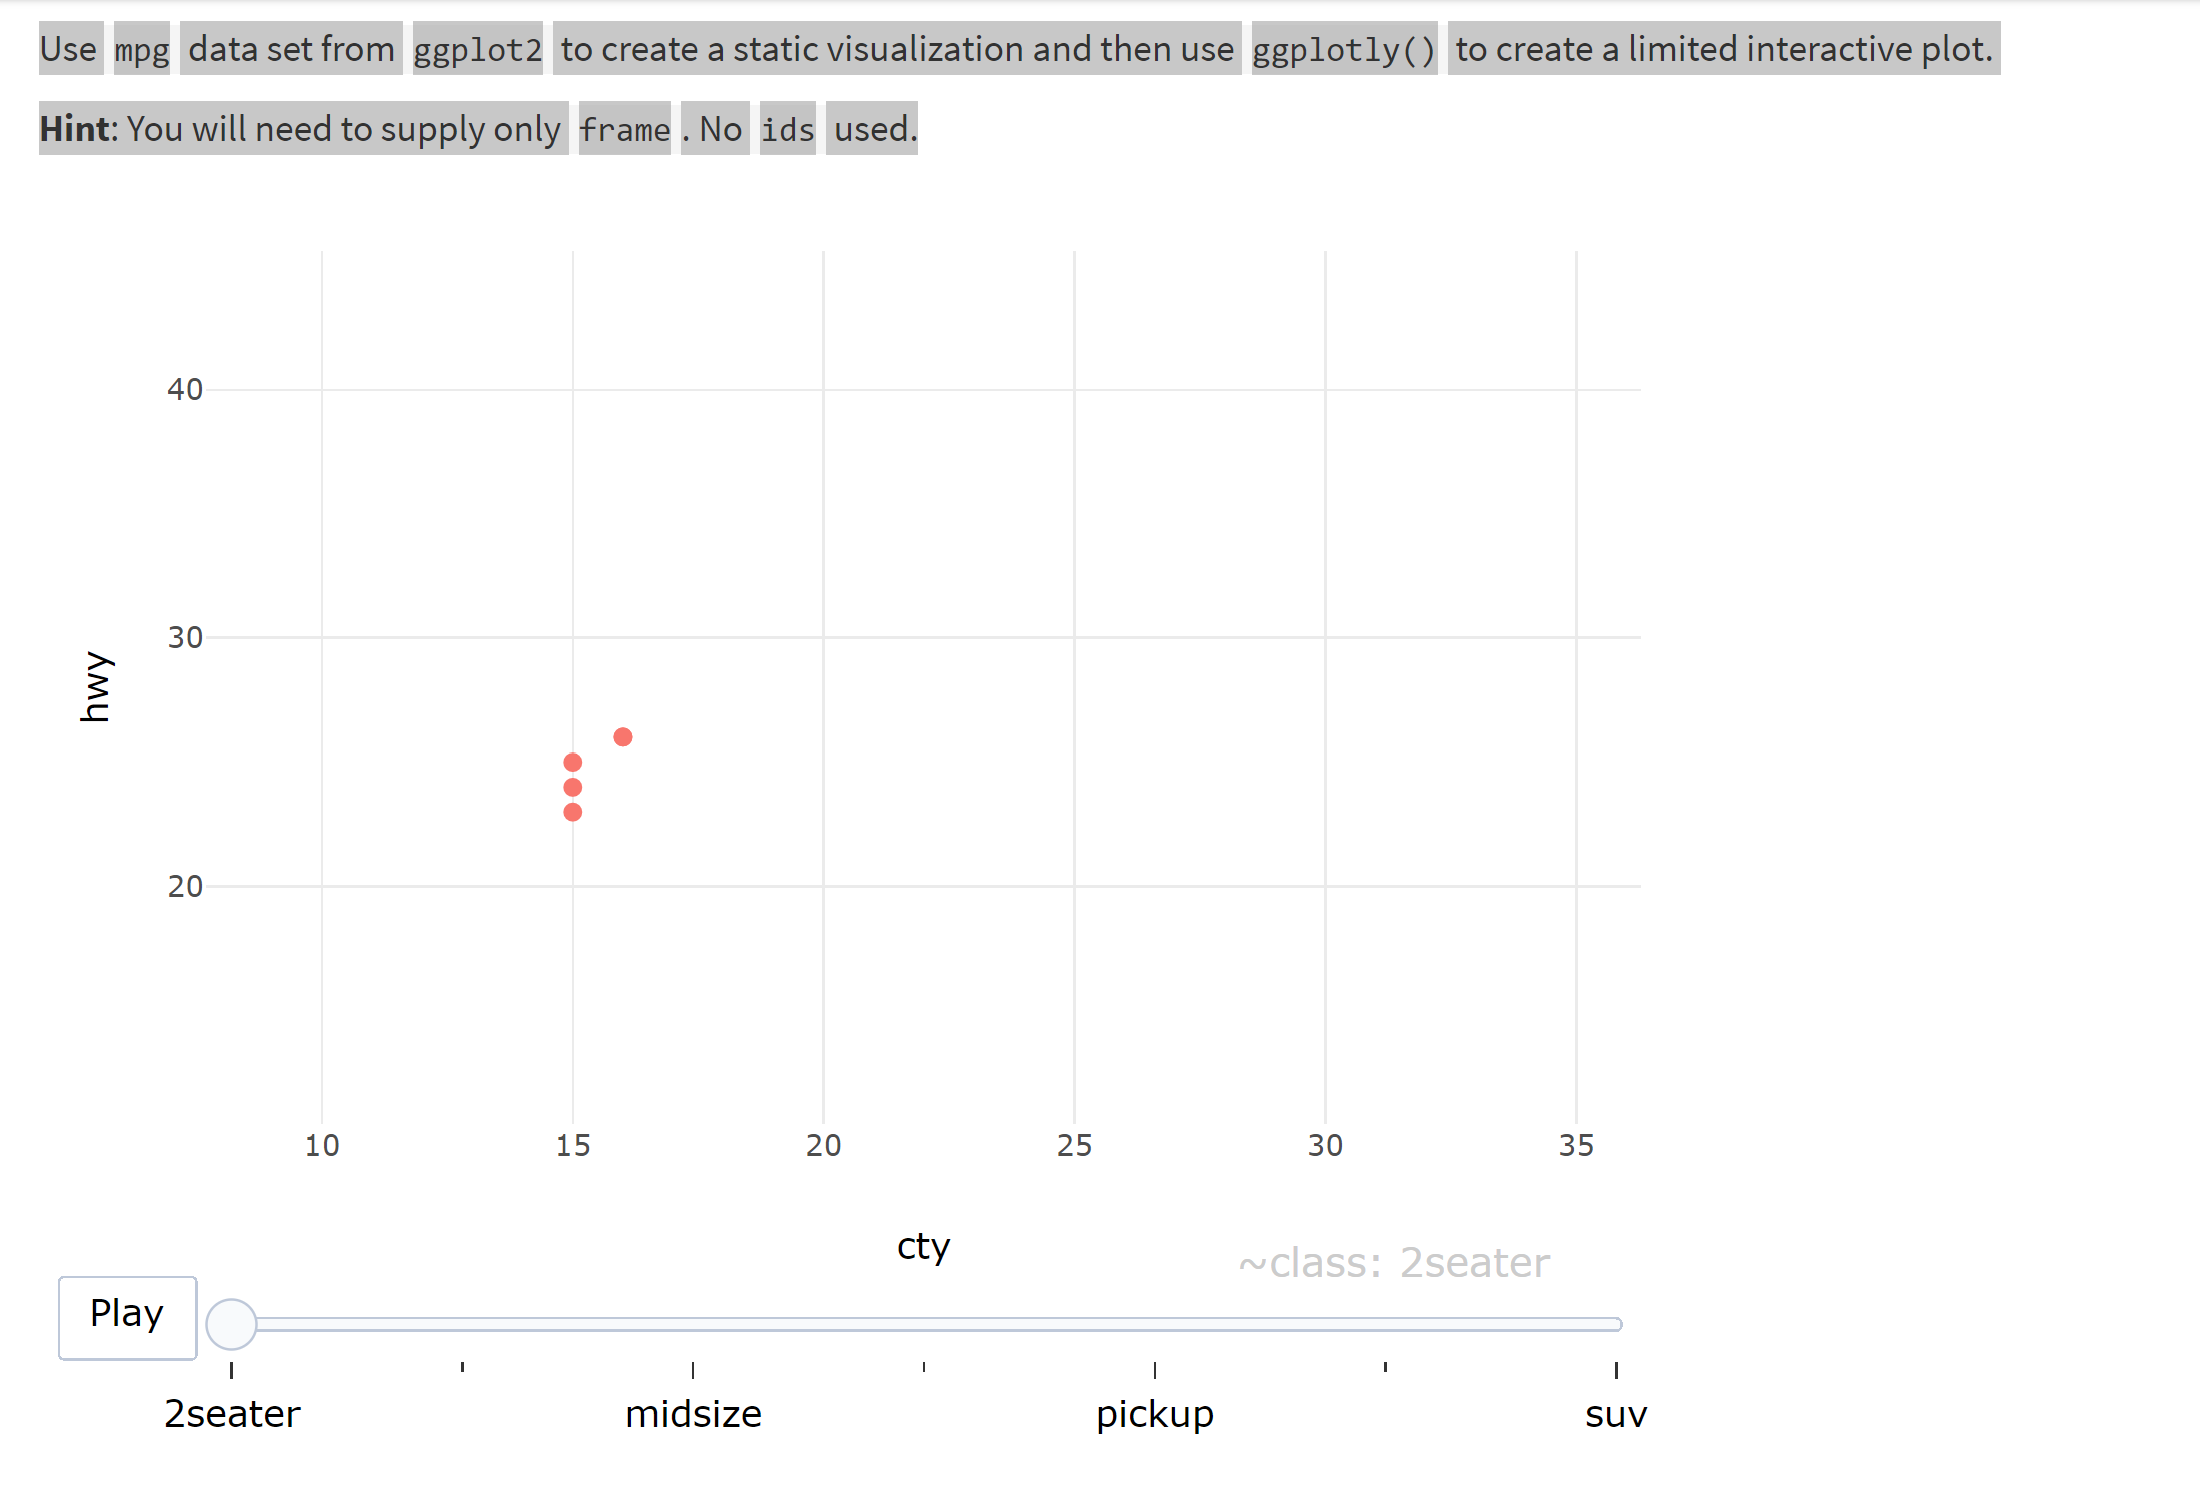
Use mpg data set from ggplot2 to create a static visualization and then use ggplotly () to create a limited interactive plot. Hint: You will need to supply only frame . No ids used. 40 30 hwy ... 20 10 15 20 25 30 35 cty ~class: 2seater Play 2seater midsize pickup suV
Step by Step Solution
There are 3 Steps involved in it
1 Expert Approved Answer
Step: 1 Unlock

Question Has Been Solved by an Expert!
Get step-by-step solutions from verified subject matter experts
Step: 2 Unlock
Step: 3 Unlock