

Question: Homework 3 Please perform all indicated calculations and answer the questions associated with each scenario. You will do this by hand (that is, not use
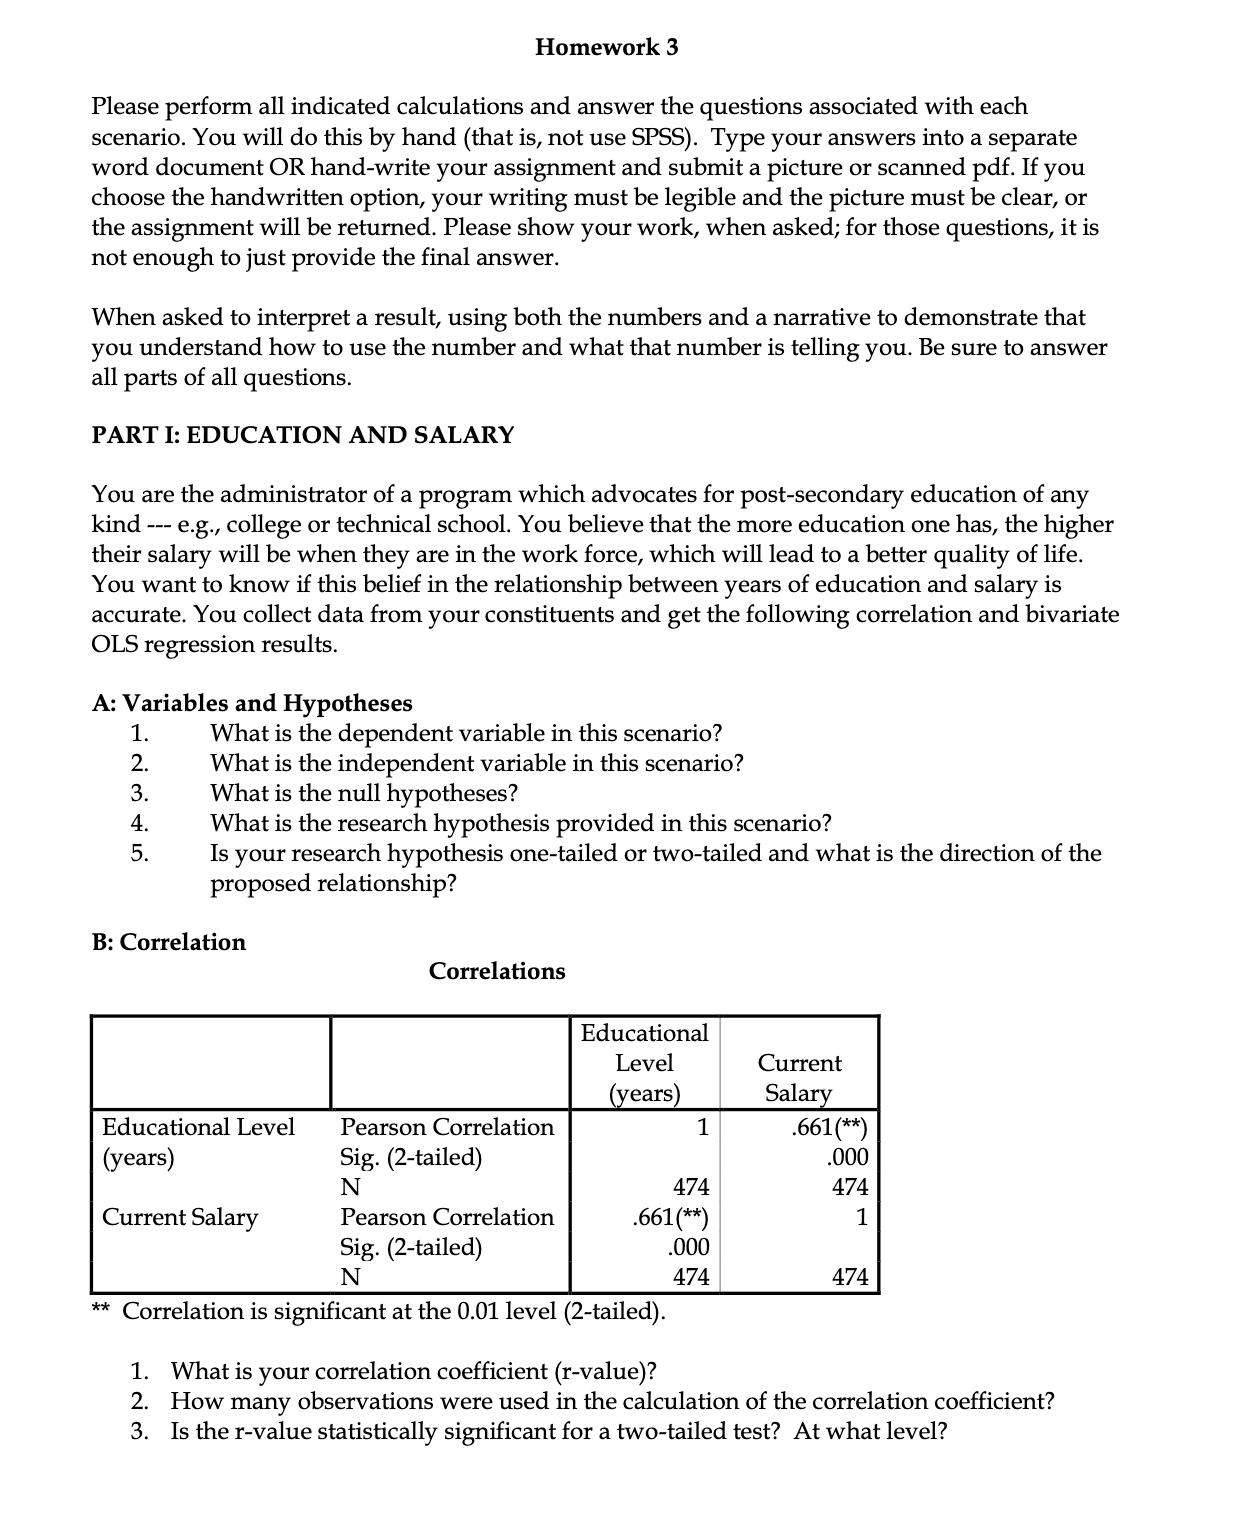
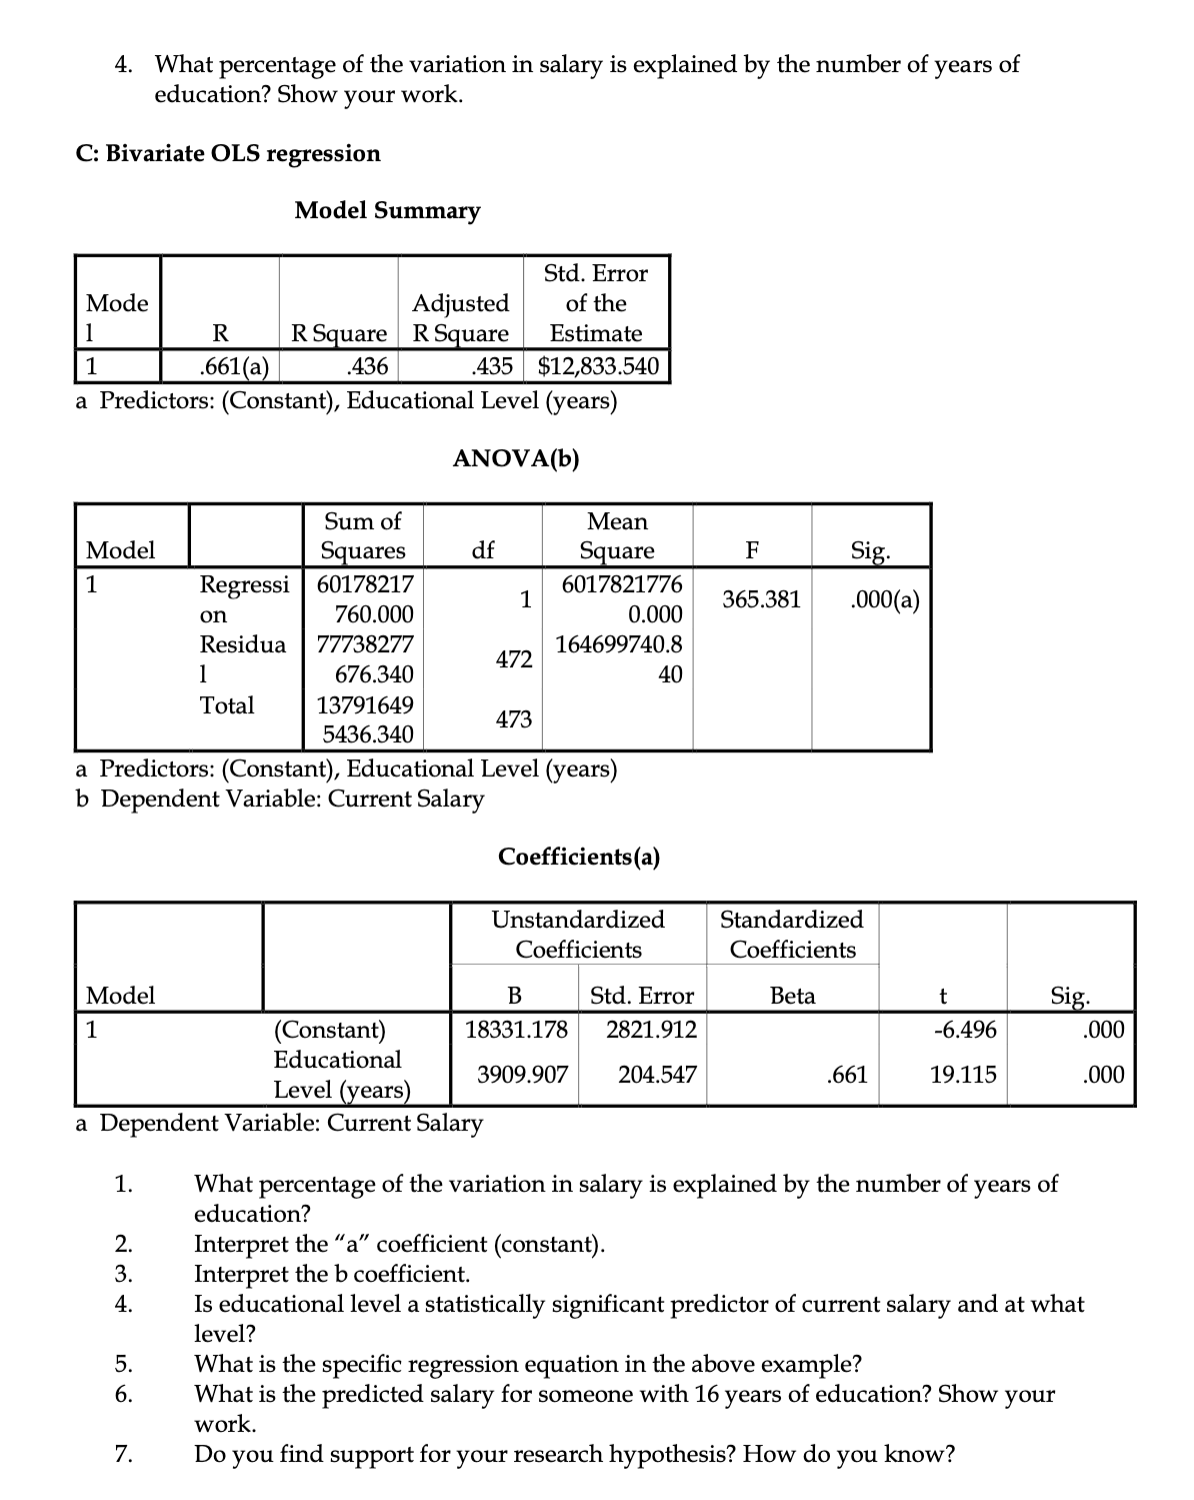
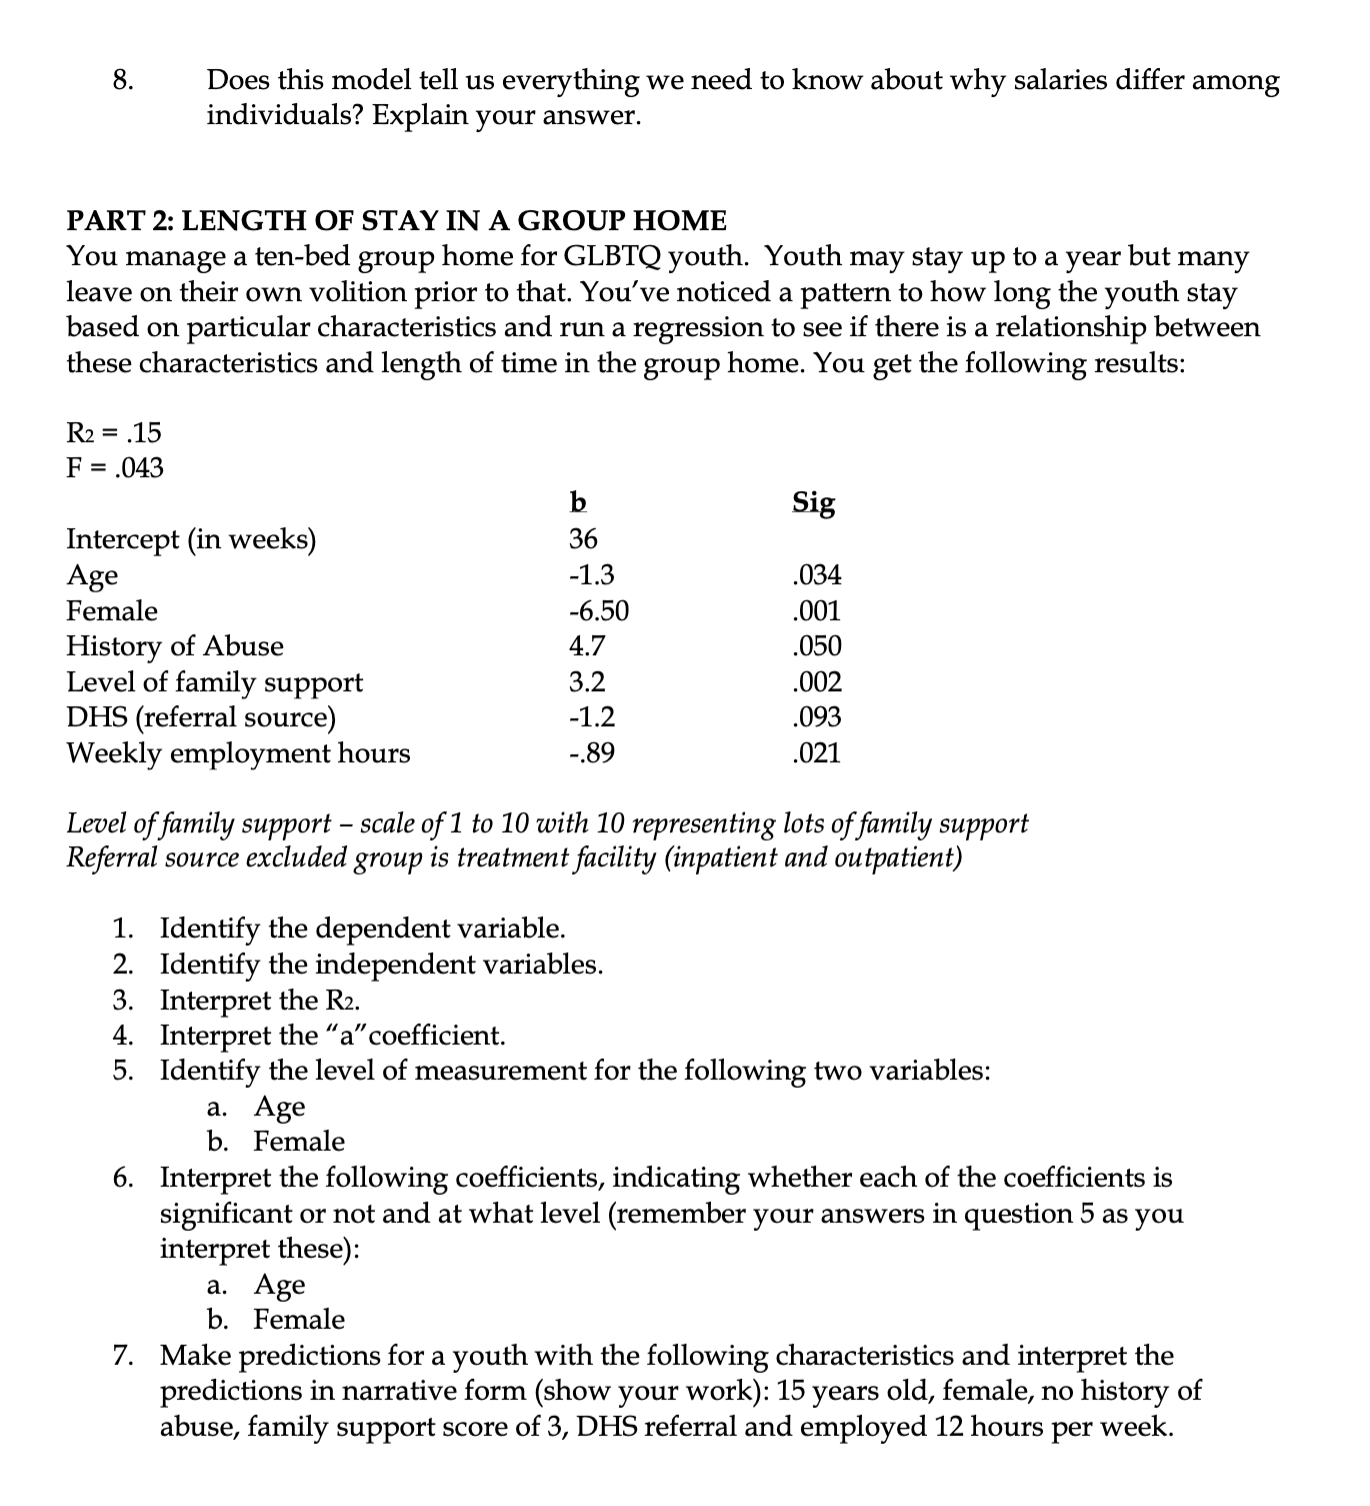 Homework 3 Please perform all indicated calculations and answer the questions associated with each scenario. You will do this by hand (that is, not use SPSS). Type your answers into a separate word document OR hand-write your assignment and submit a picture or scanned pdf. If you choose the handwritten option, your writing must be legible and the picture must be clear, or the assignment will be returned. Please show your work, when asked; for those questions, it is not enough to just provide the final answer. When asked to interpret a result, using both the numbers and a narrative to demonstrate that you understand how to use the number and what that number is telling you. Be sure to answer all parts of all questions. PART I: EDUCATION AND SALARY You are the administrator of a program which advocates for post-secondary education of any kind --- e.g., college or technical school. You believe that the more education one has, the higher their salary will be when they are in the work force, which will lead to a better quality of life. You want to know if this belief in the relationship between years of education and salary is accurate. You collect data from your constituents and get the following correlation and bivariate OLS regression results. A: Variables and Hypotheses 1. What is the dependent variable in this scenario? What is the independent variable in this scenario? What is the null hypotheses? What is the research hypothesis provided in this scenario? Is your research hypothesis one-tailed or two-tailed and what is the direction of the proposed relationship? U W B: Correlation Correlations Educational Level ( Educational Level = Pearson Correlation 661(*) (years) Sig. (2-tailed) .000 N 474 Current Salary Pearson Correlation 661(**) 1 Sig. (2-tailed) .000 N 474 ** Correlation is significant at the 0.01 level (2-tailed). 1. What is your correlation coefficient (r-value)? 2. How many observations were used in the calculation of the correlation coefficient? 3. Is the r-value statistically significant for a two-tailed test? At what level? 4. What percentage of the variation in salary is explained by the number of years of education? Show your work. C: Bivariate OLS regression Model Summary Std. Error Mode Adjusted of the R R Square | R Square | Estimate a Predictors: (Constant), Educational Level (years) ANOVA (b) --- g Model Squares Square Regressi | 60178217 6017821776 on 760.000 0.000 Residua | 77738277 164699740.8 1 676.340 40 Total 13791649 5436.340 a Predictors: (Constant), Educational Level (years) b Dependent Variable: Current Salary 365381 .000(a) Coefficients(a) Unstandardized Standardized Coefficients _ Coefficients | Model Std. Error Beta (Constant) 18331.178 | 2821.912 Educational 3909.907 | 204.547 Level (years a Dependent Variable: Current Salary 1. What percentage of the variation in salary is explained by the number of years of education? 2, Interpret the \"a\" coefficient (constant). 3. Interpret the b coefficient. 4, Is educational level a statistically significant predictor of current salary and at what level? 5. What is the specific regression equation in the above example? 6. What is the predicted salary for someone with 16 years of education? Show your work. 7. Do you find support for your research hypothesis? How do you know? Does this model tell us everything we need to know about why salaries differ among individuals? Explain your answer. PART 2: LENGTH OF STAY IN A GROUP HOME You manage a ten-bed group home for GLBTQ youth. Youth may stay up to a year but many leave on their own volition prior to that. Youve noticed a pattern to how long the youth stay based on particular characteristics and run a regression to see if there is a relationship between these characteristics and length of time in the group home. You get the following results: R2=.15 F =.043 b Sig Intercept (in weeks) 36 Age -1.3 034 Female -6.50 .001 History of Abuse 4.7 .050 Level of family support 3.2 .002 DHS (referral source) -1.2 .093 Weekly employment hours -.89 .021 Level of family support - scale of 1 to 10 with 10 representing lots of family support Referral source excluded group is treatment facility (inpatient and outpatient) GO Identify the dependent variable. Identify the independent variables. Interpret the Ra. Interpret the \"a\" coefficient. Identify the level of measurement for the following two variables: a. Age b. Female Interpret the following coefficients, indicating whether each of the coefficients is significant or not and at what level (remember your answers in question 5 as you interpret these): a. Age b. Female Make predictions for a youth with the following characteristics and interpret the predictions in narrative form (show your work): 15 years old, female, no history of abuse, family support score of 3, DHS referral and employed 12 hours per week
Step by Step Solution
There are 3 Steps involved in it
1 Expert Approved Answer
Step: 1 Unlock

Question Has Been Solved by an Expert!
Get step-by-step solutions from verified subject matter experts
Step: 2 Unlock
Step: 3 Unlock