

Question: Homework 4 Sales Comparison Approach Use the data in Table 1 to apply the sales comparison approach to the questions listed below. Show all calculations.
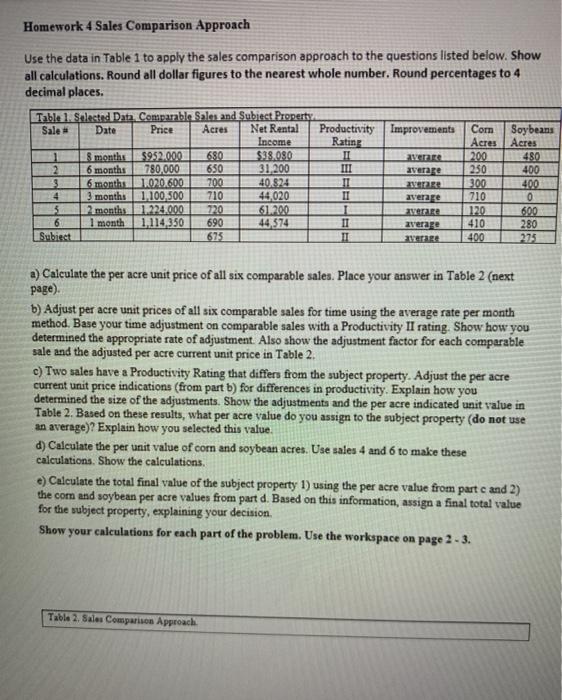
Homework 4 Sales Comparison Approach Use the data in Table 1 to apply the sales comparison approach to the questions listed below. Show all calculations. Round all dollar figures to the nearest whole number. Round percentages to 4 decimal places. Table 1. Selected Data Comparable Sales and Subiest Property Sale Date Price Acres Net Rental Income 1 $952.000 680 $38.080 2 6 months 780,000 650 31,200 6 months 1020.600 700 40.824 4 3 months 1.100,500 710 44,020 5 2 months 1.224.000 220 61.700 6 1 month 1,114,350 690 44.574 Subiect 675 Productivity Improvements Rating II WPR III averare VPRO IT averare 1 verare II average IT Fuerare Com Soybeans Acres Acres 200 480 250 400 300 710 0 120 600 410 280 400 275 a) Calculate the per acre unit price of all six comparable sales. Place your answer in Table 2 (next page) b) Adjust per acre unit prices of all six comparable sales for time using the average rate per month method. Base your time adjustment on comparable sales with a Productivity II rating. Show how you determined the appropriate rate of adjustment. Also show the adjustment factor for each comparable sale and the adjusted per acre current unit price in Table 2. c) Two sales have a Productivity Rating that differs from the subject property. Adjust the per acre current unit price indications (from part b) for differences in productivity. Explain how you determined the size of the adjustments. Show the adjustments and the per acre indicated unit value in Table 2. Based on these results, what per acre value do you assign to the subject property (do not use an average)? Explain how you selected this value. d) Calculate the per unit value of com and soybean acres. Use sales 4 and 6 to make these calculations. Show the calculations e) Calculate the total final value of the subject property 1) using the per acre value from partc and 2) the com and soybean per acre values from part d. Based on this information, assign a final total value for the subject property, explaining your decision Show your calculations for each part of the problem. Use the workspace on page 2 - 3. Table 2. Sales Comparison Approach Homework 4 Sales Comparison Approach Use the data in Table 1 to apply the sales comparison approach to the questions listed below. Show all calculations. Round all dollar figures to the nearest whole number. Round percentages to 4 decimal places. Table 1. Selected Data Comparable Sales and Subiest Property Sale Date Price Acres Net Rental Income 1 $952.000 680 $38.080 2 6 months 780,000 650 31,200 6 months 1020.600 700 40.824 4 3 months 1.100,500 710 44,020 5 2 months 1.224.000 220 61.700 6 1 month 1,114,350 690 44.574 Subiect 675 Productivity Improvements Rating II WPR III averare VPRO IT averare 1 verare II average IT Fuerare Com Soybeans Acres Acres 200 480 250 400 300 710 0 120 600 410 280 400 275 a) Calculate the per acre unit price of all six comparable sales. Place your answer in Table 2 (next page) b) Adjust per acre unit prices of all six comparable sales for time using the average rate per month method. Base your time adjustment on comparable sales with a Productivity II rating. Show how you determined the appropriate rate of adjustment. Also show the adjustment factor for each comparable sale and the adjusted per acre current unit price in Table 2. c) Two sales have a Productivity Rating that differs from the subject property. Adjust the per acre current unit price indications (from part b) for differences in productivity. Explain how you determined the size of the adjustments. Show the adjustments and the per acre indicated unit value in Table 2. Based on these results, what per acre value do you assign to the subject property (do not use an average)? Explain how you selected this value. d) Calculate the per unit value of com and soybean acres. Use sales 4 and 6 to make these calculations. Show the calculations e) Calculate the total final value of the subject property 1) using the per acre value from partc and 2) the com and soybean per acre values from part d. Based on this information, assign a final total value for the subject property, explaining your decision Show your calculations for each part of the problem. Use the workspace on page 2 - 3. Table 2. Sales Comparison Approach
Step by Step Solution
There are 3 Steps involved in it

Get step-by-step solutions from verified subject matter experts