

Question: = Homework: 6.5 Ass... Question /, 0..If-1 HW Score: 60%, 6 of 10 points Save Part 1 of 4 O Points: 0 of 1 Na
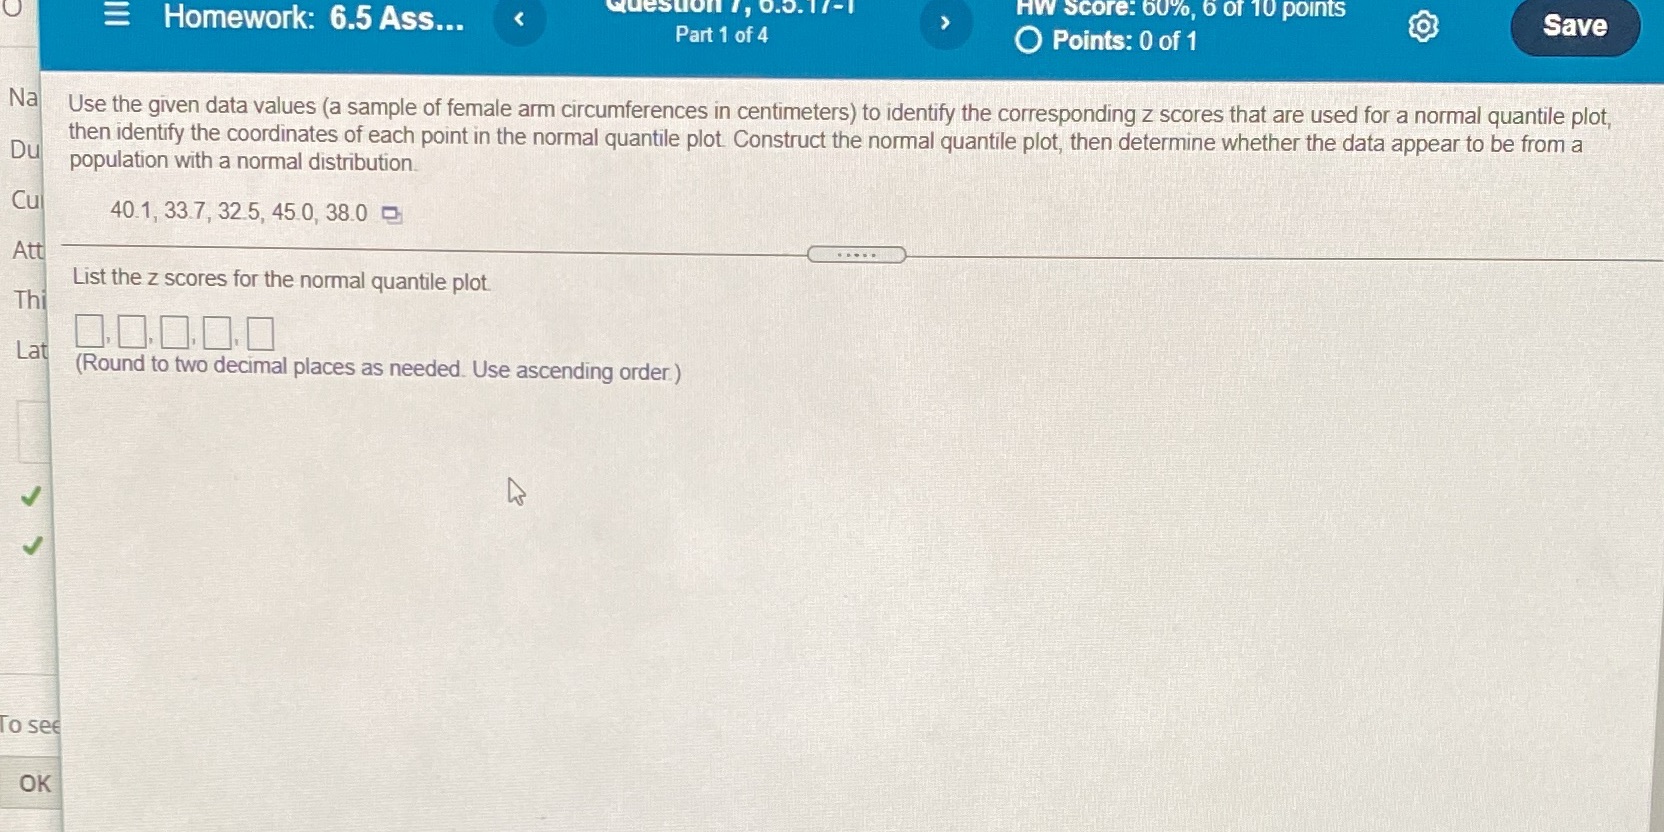
= Homework: 6.5 Ass... Question /, 0..If-1 HW Score: 60%, 6 of 10 points Save Part 1 of 4 O Points: 0 of 1 Na Use the given data values (a sample of female arm circumferences in centimeters) to identify the corresponding z scores that are used for a normal quantile plot, then identify the coordinates of each point in the normal quantile plot Construct the normal quantile plot, then determine whether the data appear to be from a Du population with a normal distribution. Cu 40.1, 33.7, 32.5, 45 0, 38.0 Att List the z scores for the normal quantile plot. Thi Lat 0.0 0 0.0 (Round to two decimal places as needed. Use ascending order) To see OK
Step by Step Solution
There are 3 Steps involved in it

Get step-by-step solutions from verified subject matter experts