

Question: Homework 9: Correlation and Linear Regression Reading Assignment 0 Chapters 17 and 18 in the textbook The Data Sets 1) Birth weight and gestational age
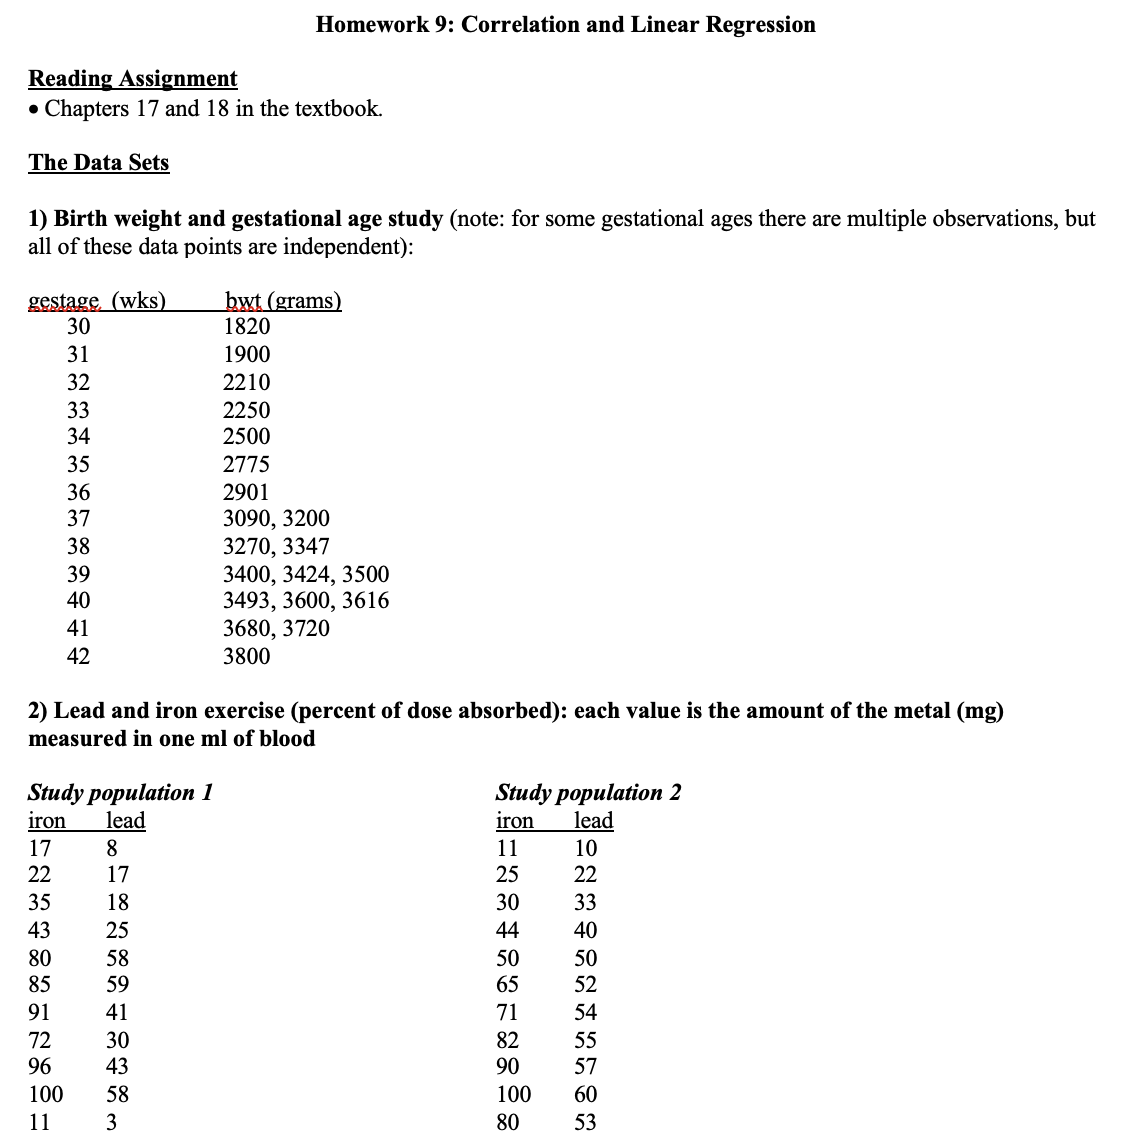

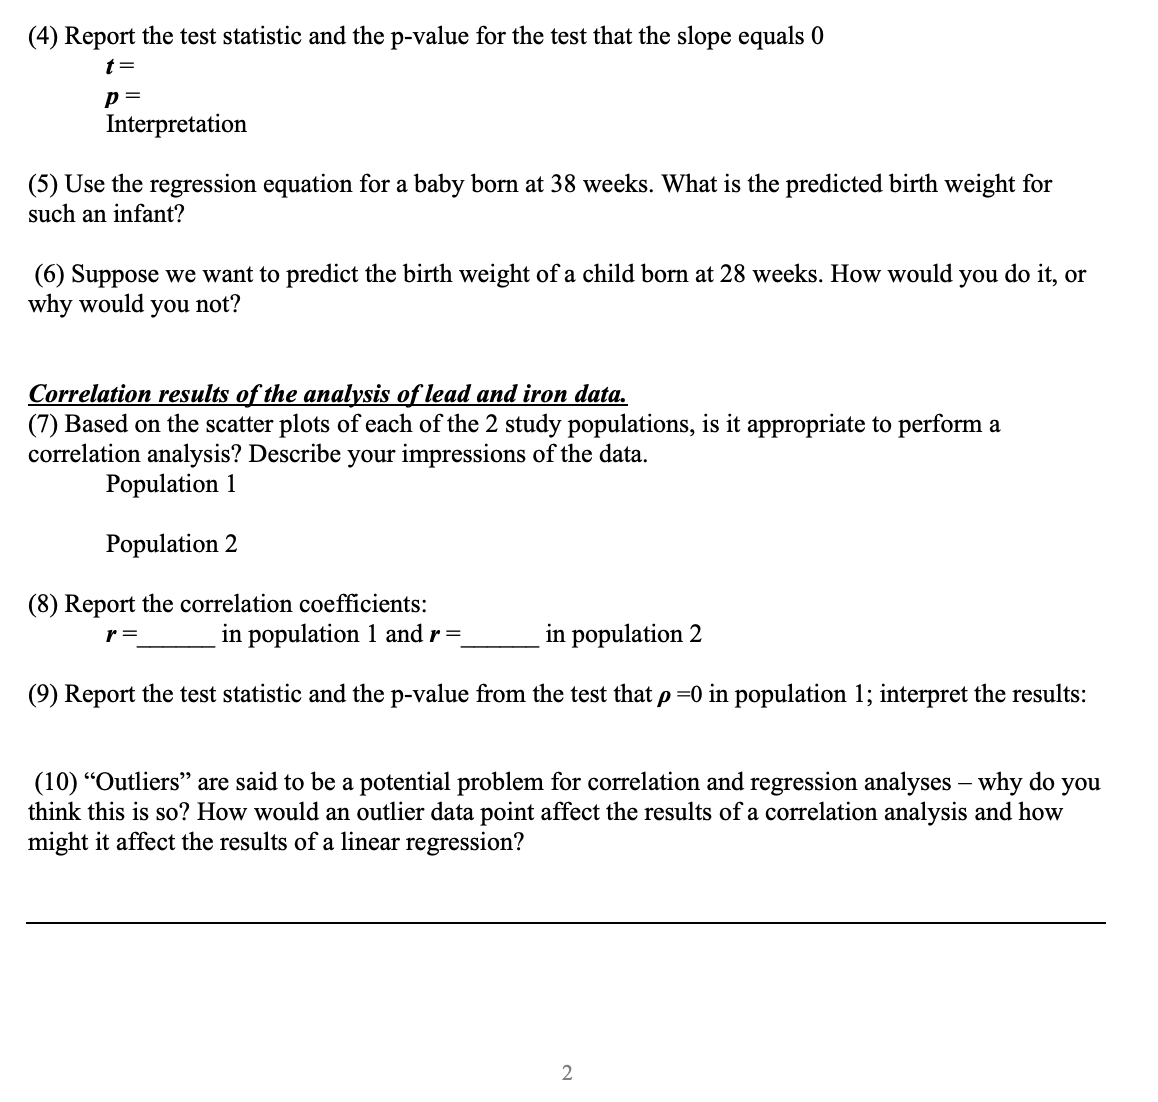
Homework 9: Correlation and Linear Regression Reading Assignment 0 Chapters 17 and 18 in the textbook The Data Sets 1) Birth weight and gestational age study (note: for some gestational ages there are multiple observations, but all of these data points are independent): VVkS anus 30 1820 31 1900 32 2210 33 2250 34 2500 35 2775 36 2901 37 3090,3200 38 3270,3347 39 3400,3424,3500 40 3493,3600,3616 41 3680,3720 42 3800 2) Lead and iron exercise (percent of dose absorbed): each value is the amount of the metal (mg) measured in one ml of blood Study population 1 Study population 2 iron lead iron lead 17 8 11 10 22 17 25 22 35 18 30 33 43 25 44 40 80 S8 50 50 85 59 65 52 91 41 71 54 72 30 82 S5 96 43 90 57 100 58 100 60 1 1 3 80 S3 INSTRUCTIONS: 1. Make a scatter-plot of the relationship of gestational age (in weeks, on the xaxis) to birth weight (in grams, on the yaxis). 2. Perform a linear regression analysis for the model: m = m Add the tted regression line to the plot. Answer questions 1-6 on the worksheet about the data plot and regression results 3. Make separate scatter-plots of the iron and lead data from the 2 different study populations (it does not matter which variables are plotted on the x- and y-axes). Compute the correlation coefcients and test the null hypothesis that p =0 for each population separately. Answer questions 7-10 on the worksheet. NOTE: do not have to include graphs. Homework 9 Name Questions about the analysis at birth weight and gestational age: (1) What is your impression from the scatter plot with the tted regression line, in terms of how well the linear regression model appears to t the data? (2) Report the estimated glgpg and estimated intercept _ Interpretation (3) Report and interpret the R2 value. R2 = Interpretation (4) Report the test statistic and the p-value for the test that the slope equals 0 t = p = Interpretation (4) Report the test statistic and the p-value for the test that the slope equals 0 t = p = Interpretation (5) Use the regression equation for a baby born at 38 weeks. What is the predicted birth weight for such an infant? (6) Suppose we want to predict the birth weight of a child born at 28 weeks. How would you do it, or why would you not? Correlation results of the analysis of lead and iron data. (7) Based on the scatter plots of each of the 2 study populations, is it appropriate to perform a correlation analysis? Describe your impressions of the data. Population 1 Population 2 (8) Report the correlation coefcients: r = in population 1 and r = in population 2 (9) Report the test statistic and the p-value from the test that p =0 in population 1; interpret the results: (10) \"Outliers\" are said to be a potential problem for correlation and regression analyses why do you think this is so? How would an outlier data point a'ect the results of a correlation analysis and how might it affect the results of a linear regression
Step by Step Solution
There are 3 Steps involved in it

Get step-by-step solutions from verified subject matter experts