

Question: = Homework: ACC-360 Topic 4 Assignment Question 7, P5-37 (sin Part 1 of 16 x Data table X gments Data table Pharmahelp 2017 hents General
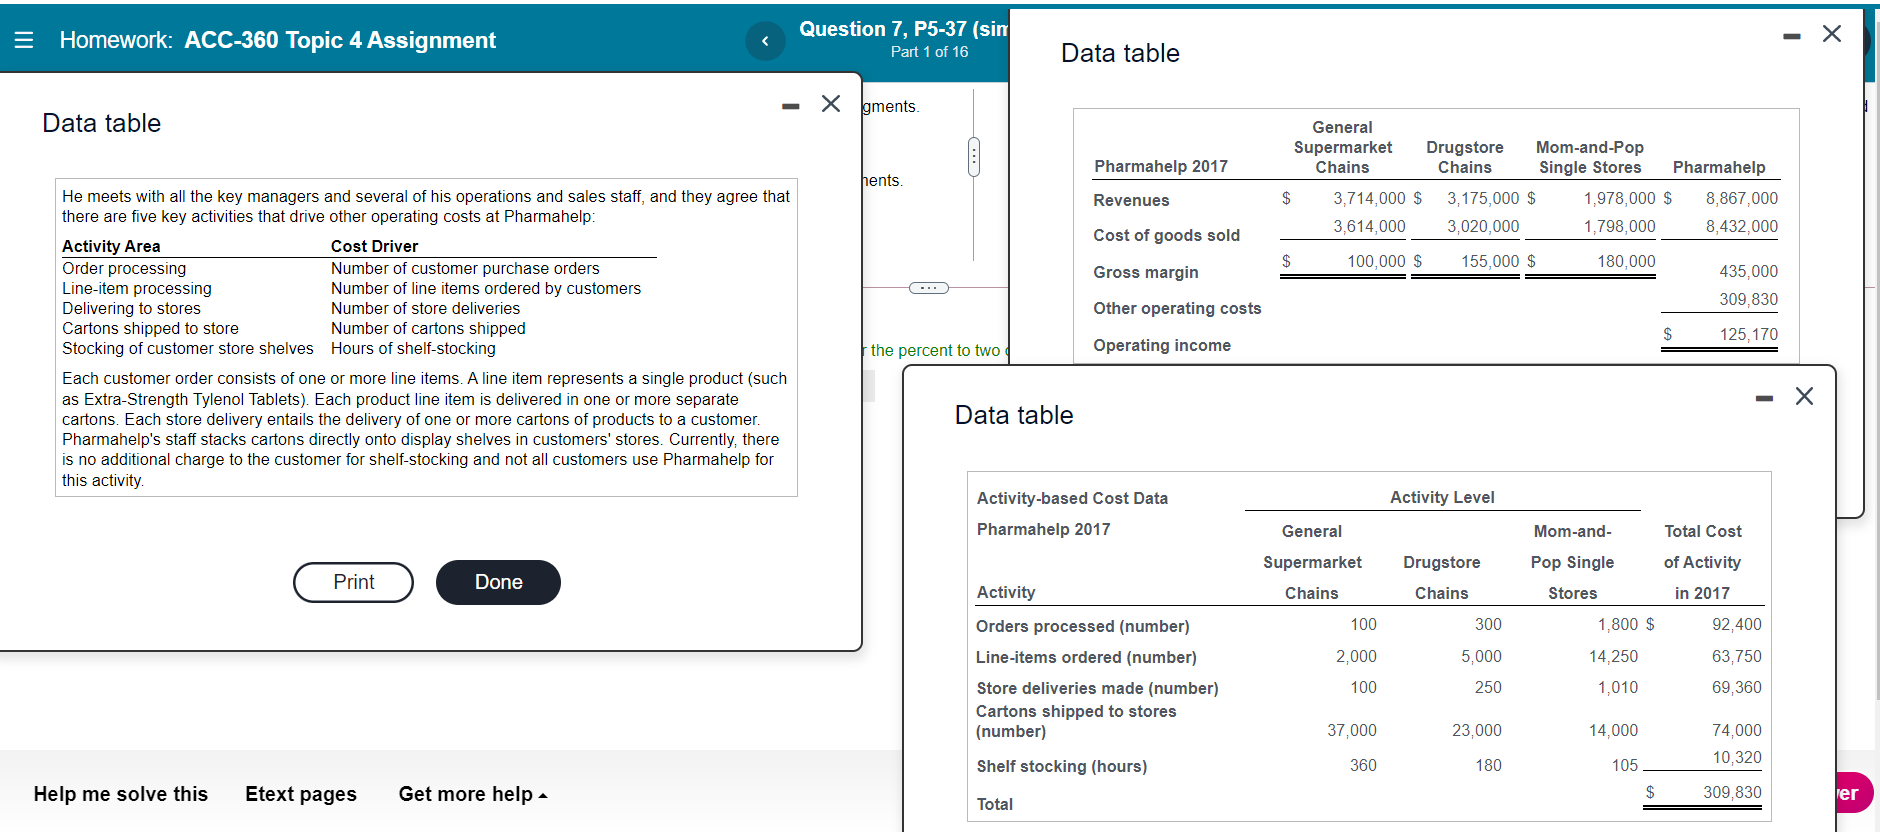
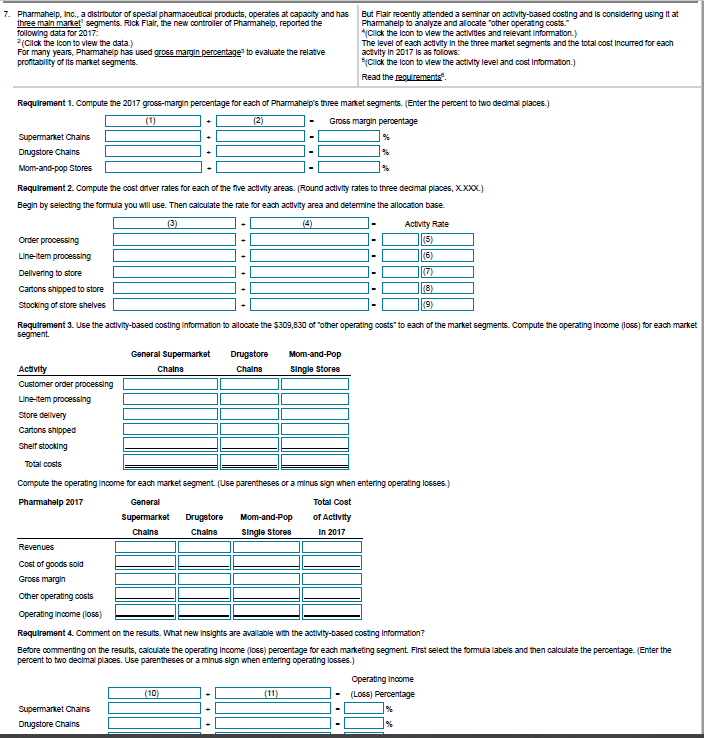
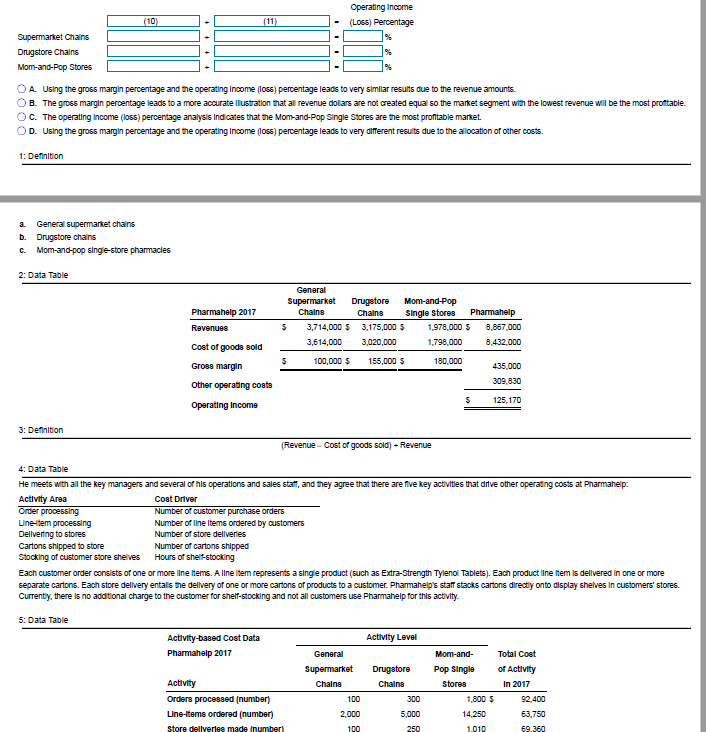
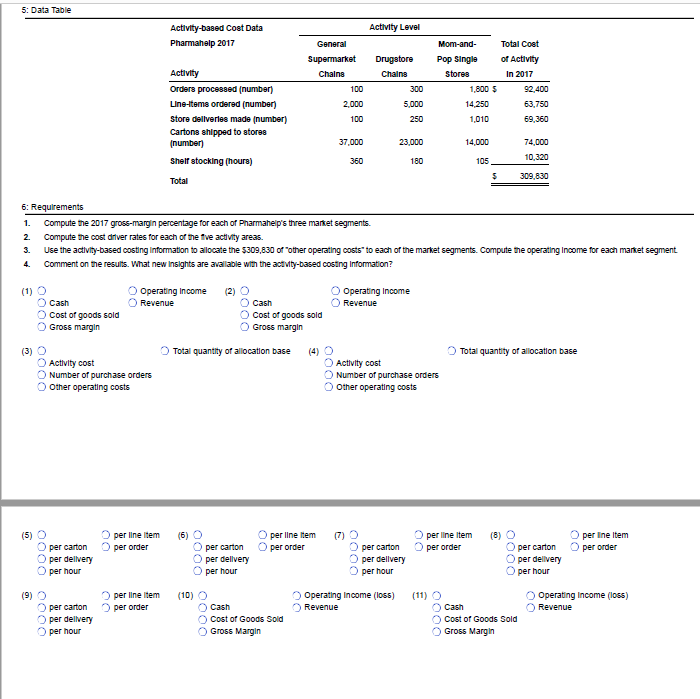
= Homework: ACC-360 Topic 4 Assignment Question 7, P5-37 (sin Part 1 of 16 x Data table X gments Data table Pharmahelp 2017 hents General Supermarket Drugstore Mom-and-Pop Chains Chains Single Stores Pharmahelp $ 3,714,000 $ 3,175,000 $ 1,978,000 $ 8,867,000 3,614,000 3,020,000 1,798,000 8,432,000 Revenues Cost of goods sold 100,000 $ 155,000 $ 180,000 Gross margin 435,000 ... 309,830 Other operating costs He meets with all the key managers and several of his operations and sales staff, and they agree that there are five key activities that drive other operating costs at Pharmahelp: Activity Area Cost Driver Order processing Number of customer purchase orders Line-item processing Number of line items ordered by customers Delivering to stores Number of store deliveries Cartons shipped to store Number of cartons shipped Stocking of customer store shelves Hours of shelf-stocking Each customer order consists of one or more line items. A line item represents a single product (such as Extra-Strength Tylenol Tablets). Each product line item is delivered in one or more separate cartons. Each store delivery entails the delivery of one or more cartons of products to a customer. Pharmahelp's staff stacks cartons directly onto display shelves in customers' stores. Currently, there is no additional charge to the customer for shelf-stocking and not all customers use Pharmahelp for this activity $ 125,170 the percent to two Operating income Data table Activity Level Activity-based Cost Data Pharmahelp 2017 General Mom-and- Total Cost Supermarket Drugstore Pop Single of Activity Print Done Activity Chains Chains Stores in 2017 100 300 1,800 $ 92,400 2,000 5,000 14,250 63,750 Orders processed (number) Line-items ordered (number) Store deliveries made (number) Cartons shipped to stores (number) 100 250 1,010 69,360 37,000 23,000 14,000 74,000 10,320 Shelf stocking (hours) 360 180 105 Help me solve this Etext pages Get more help $ 309,830 er Total 7. Pharmahelp, Inc., a distributor of special pharmaceutical products, operates at capacity and has three main market segments. Rick Flair, the new controler of Pharmahelp, reported the following data for 2017: *(Click the icon to view the data.) For many years, Pharmahelp has used gross margin percentage to evaluate the relative profitability of its market segments. But Flair recently attended a seminar on activity-based costing and is considering using it at Phamahelp to analyze and allocate other operating costs." Click the icon to view the activities and relevant information.) The level of each activity in the three market segments and the total cost incurred for each activity in 2017 is as follows: Si click the icon to view the activity level and cost Information.) Read the regulirements Requirement 1. Compute the 2017 gross-margin percentage for each of Pharmahep's three market segments. (Enter the percent to two decimal places.) (1) (2) Gross margin percentage Supermarket Chains Drugstore Chains Mom-and-pop Stores Requirement 2. Compute the cost dirver rates for each of the five activity areas. (Round activity rates to three decimal places, XXXox.) Begin by selecting the formula you will use. Then calculate the rate for each activity area and determine the allocation base. (3) 14) Activity Rate Order processing (5) Line-Item processing Dellvering to store (7) Cartons shipped to store Stocking of store shelves (9) Requirement 3. Use the activity-based costing information to allocate the $309,830 of other operating costs to each of the market segments. Compute the operating Income (los) for each market segment General Supermarket Drugstore Mom-and-Pop Activity Chains Single Stores Customer order processing Line-tem processing Store dellvery Cartons shipped Shelf stocking Chains Total costs Compute the operating income for each market segment (Use parentheses or a minus sign when entering operating losses.) Pharmahelp 2017 General Total Cost Supermarket Drugstore Mom-and-Pop of Activity Chains Chains Single Stores In 2017 Revenues Cost of goods sold Gross margin Other operating costs Operating income (105) Requirement 4. Comment on the results. What new Insights are available with the activity-based costing Information? Before commenting on the results, calculate the operating Income (loss) percentage for each marketing segment. First select the formula labels and then calculate the percentage (Enter the percent to two decimal places. Use parentheses or a minus sign when entering operating losses.) Operating Income (10) (11) (LOSS) Percentage Supermarket Chains % Drugstore Chains Operating Income (LOSS) Percentage (10) (11) Supermarket Chains Drugstore Chains Mom-and-Pop Stores % % A. Using the gross margin percentage and the operating Income (1055) percentage leads to very similar results due to the revenue amounts. OB. The gross margin percentage leads to a more accurate Illustration that all revenue dollars are not created equalso the market segment with the lowest revenue will be the most proftable. OC. The operating Income (loss) percentage analysis indicates that the mom-and-Pop Single Stores are the most profitable market OD. Using the gross margin percentage and the operating Income (los) percentage leads to very different resuits due to the allocation of other costs. 1: Definition a. General supermarket chains b. Drugstore chains C. Mom-and-pop single store pharmacies 2: Data Table Pharmahelp 2017 Revenues General Supermarket Drugstore Mom-and-Pop Chains Chains Single Stores 5 3,714,000 5 3,175,000 $ 1,978,000 3,614,000 3,020,000 1,798,000 5 100,000 5 155,000 $ 180.000 Pharmahelp 8,857.000 8,432,000 Cost of goods sold Gross margin Other operating costs Operating Income 435,000 309,830 s 125,170 3: Definition (Revenue - Cost of goods sold) - Revenue 4: Data Table He meets with all the key managers and several of his operations and sales staff, and they agree that there are five key activities that drive other operating costs at Pharmahelp: Activity Arsa Coat Driver Order processing Number of customer purchase orders Line-Item processing Number of line Items ordered by customers Delivering to stores Number of store dellveries Cartons shipped to store Number of cartons shipped Stocking of customer store shelves Hours of shelf-stocking Each customer order consists of one or more line items. A line item represents a single product (such as Extra-Strength Tylenoi Tablets). Each product line item is dellvered in one or more separate cartons. Each store dellvery entals the dellvery of one or more cartons of products to a customer. Pharmahelp's staff stacks cartons directly onto display shelves in customers' stores. Currently, there is no additional charge to the customer for shelf-stocking and not all customers use Pharmahelp for this activity. 5: Data Table Activity Level Activity-based Coat Data Pharmahelp 2017 General Supermarket Chains 100 Drugstore Chains 300 Mom-and- Pop Single Stores Total Cost of Activity In 2017 1,800 $ 92,400 Activity Orders processed (number) Line-Items ordered (number) Store dellverleg mede Inumber 14.250 2.000 100 5,000 250 63,750 69.360 1.010 5: Data Table Activity Level Activity-based Cost Data Pharmahelp 2017 Activity Orders processed (number Line-Items ordered (number) Store dellveries made (number) Cartons shipped to stores (number) Shelf stocking (hours) General Supermarket Chalna 100 2.000 100 Drugstore Chains 300 5,000 250 Mom-and- Total Coat Pop Single of Activity Stores In 2017 1,800 $ 92,400 14.250 63,750 1,010 69,360 37,000 23,000 14,000 74,000 10,320 360 180 TOS 5 Total 309,830 6: Requirements 1. Compute the 2017 gross-margin percentage for each of Pharmaheip's three market segments. 2. Compute the cost driver rates for each of the five activity areas. 3. Use the activity-based costing information to allocate the $309,830 of other operating costs to each of the market segments. Compute the operating Income for each market segment 4. Comment on the results. What new insights are available with the activity-based costing Information? (1) Operating Income Revenue Operating Income Cash Revenue 0000 Cash Cost of goods sold Gross margin Cost of goods sold Gross margin 3) Total quantity of allocation base (4) (4) Total quantity of allocation base Activity cost Number of purchase orders Other operating costs 0000 Activity cost Number of purchase orders Other operating costs (6) per line item per order 17) per line item O per order per line item per order 0000 per Ine item per order per carton per delivery per hour per carton per delivery per hour per carton per delivery per hour (8) O per carton per delivery per hour (9) per line item per order (10) Operating Income (loss) Revenue (11) Operating Income (loss) Revenue per carton per dellvery per hour 000 Cash Cost of Goods Sold Gross Margin Cash Cost of Goods Sold Gross Margin
Step by Step Solution
There are 3 Steps involved in it

Get step-by-step solutions from verified subject matter experts