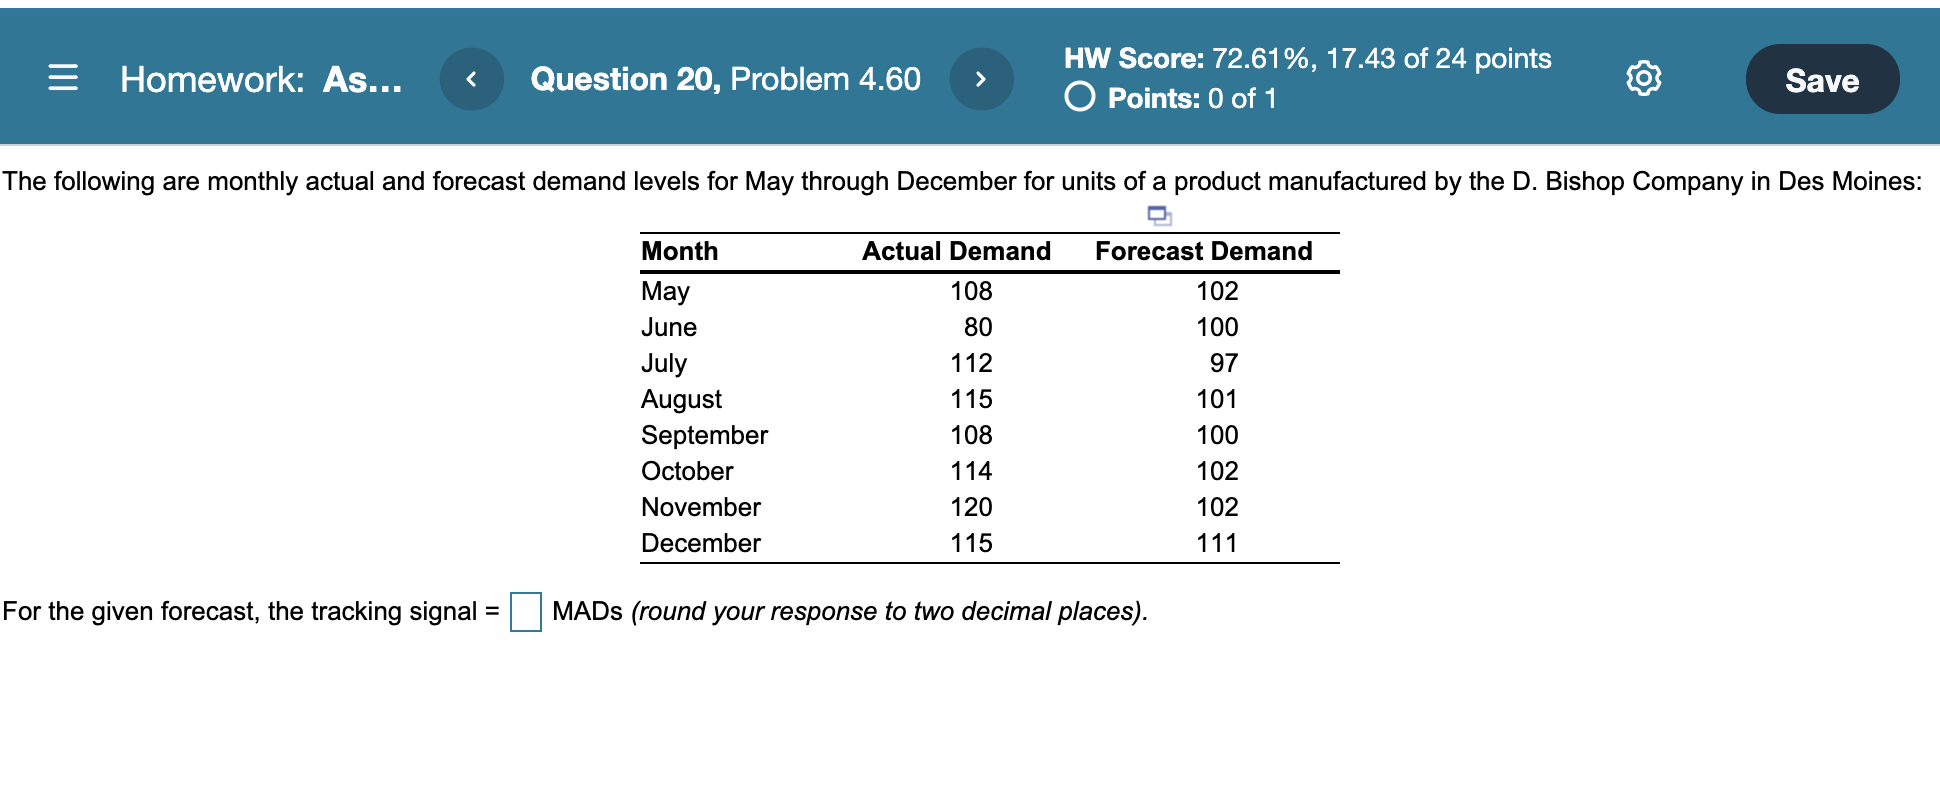
Question: = Homework: As... Question 20, Problem 4.60 > HW Score: 72.61%, 17.43 of 24 points O Points: 0 of 1 Save The following are monthly

= Homework: As... Question 20, Problem 4.60 > HW= Homework: As... Question 20, Problem 4.60 > HW

= Homework: As... Question 20, Problem 4.60 > HW Score: 72.61%, 17.43 of 24 points O Points: 0 of 1 Save The following are monthly actual and forecast demand levels for May through December for units of a product manufactured by the D. Bishop Company in Des Moines: Month Actual Demand Forecast Demand 102 100 97 101 May June July August September October November December 108 80 112 115 108 114 120 115 100 102 102 111 For the given forecast, the tracking signal = MADs (round your response to two decimal places). = Homework: As... Question 13, Problem 4.3a Part 2 of 2 > HW Score: 72.61%, 17.43 of 24 points Points: 0.5 of 1 Save The following table shows the actual demand observed over the last 11 years: Year 1 2 3 4 5 6 7 8 9 10 11 Demand 7 9 6 7 12 9 12 12 10 13 7 Using exponential smoothing with a = 0.50 and a forecast for year 1 of 6.0, provide the forecast from periods 2 through 12 (round your responses to one decimal place). Year 1 2 3 4 5 6 7 8 9 10 11 12 Forecast 6.0 6.5 5 7.75 6.888 94 9.4 6.94 9.47 9.24 24 10. 10.62 11.31 10.65 11.83 .65 11.83 9. 9.41 Provide the forecast from periods 2 through 12 using the naive approach (enter your responses as whole numbers). Year 2 3 4 5 6 7 8 9 10 11 12 Forecast

Step by Step Solution

There are 3 Steps involved in it

1 Expert Approved Answer
Step: 1 Unlock blur-text-image
Question Has Been Solved by an Expert!

Get step-by-step solutions from verified subject matter experts

Step: 2 Unlock
Step: 3 Unlock

Students Have Also Explored These Related General Management Questions!