

Question: Homework: Assignment 3 Question 11, 3.2.35 HW Score: 55.73%, 17.83 of 32 Part 6 of 6 points Points: 0.67 of 1 Save The given graph
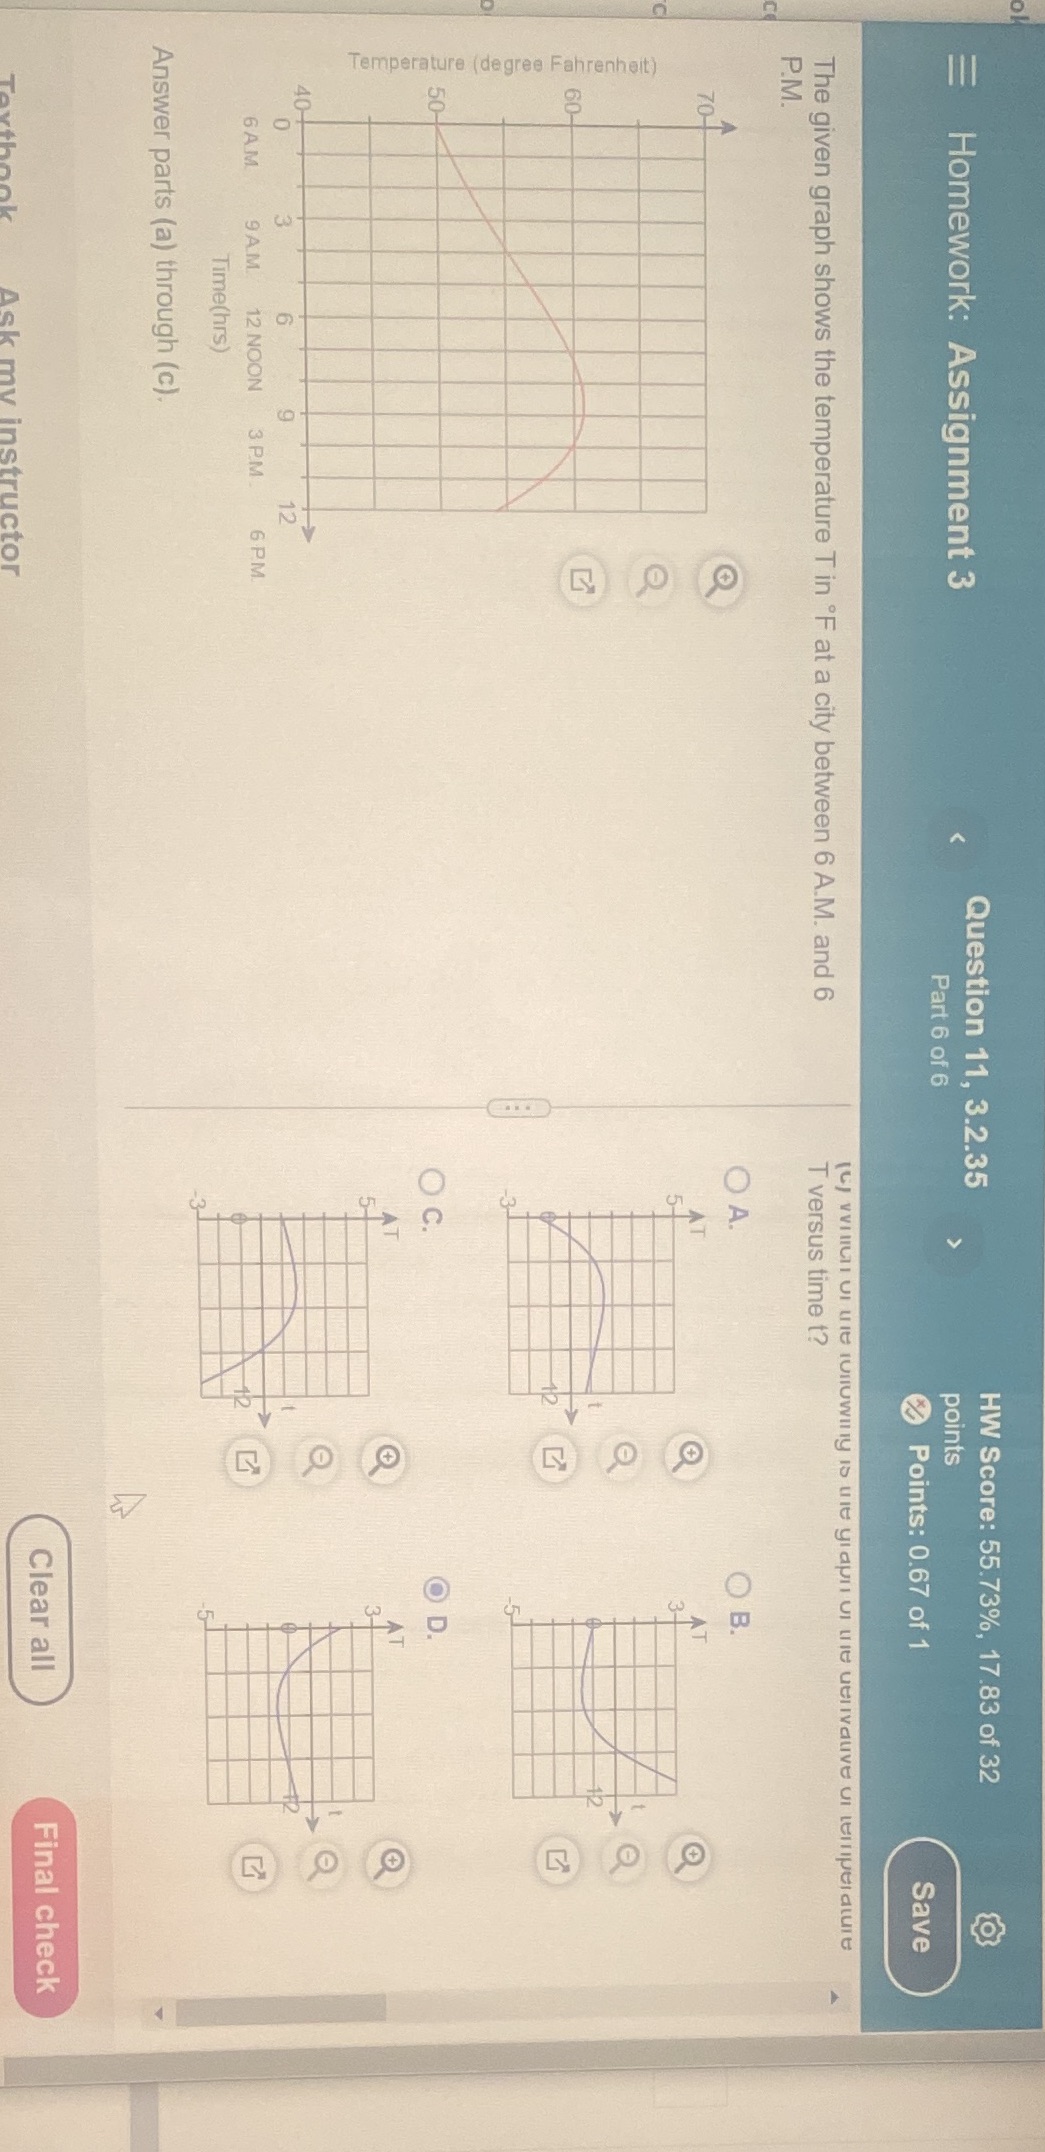
Homework: Assignment 3 Question 11, 3.2.35 HW Score: 55.73%, 17.83 of 32 Part 6 of 6 points Points: 0.67 of 1 Save The given graph shows the temperature T in 'F at a city between 6 A.M. and 6 CJ VITTI UI TIE TINUWITTy IS wie yeapII UI Tie uelIvauve un temperature P.M. T versus time t? O A. O B. 8 Temperature (degree Fahrenheit ) O C. O O 6 AM 9AM 12 NOON 3 PM 6 PM. Time(hrs) Answer parts (a) through (c). Clear all Final check
Step by Step Solution
There are 3 Steps involved in it
1 Expert Approved Answer
Step: 1 Unlock

Question Has Been Solved by an Expert!
Get step-by-step solutions from verified subject matter experts
Step: 2 Unlock
Step: 3 Unlock