

Question: Homework: Ch 8 HW: Sampling Distribution Question 5, 8.1.13 HW Score: 68.29%, 12.98 of 19 points Part 4 of 4 Points: 0.75 of 1 Complete
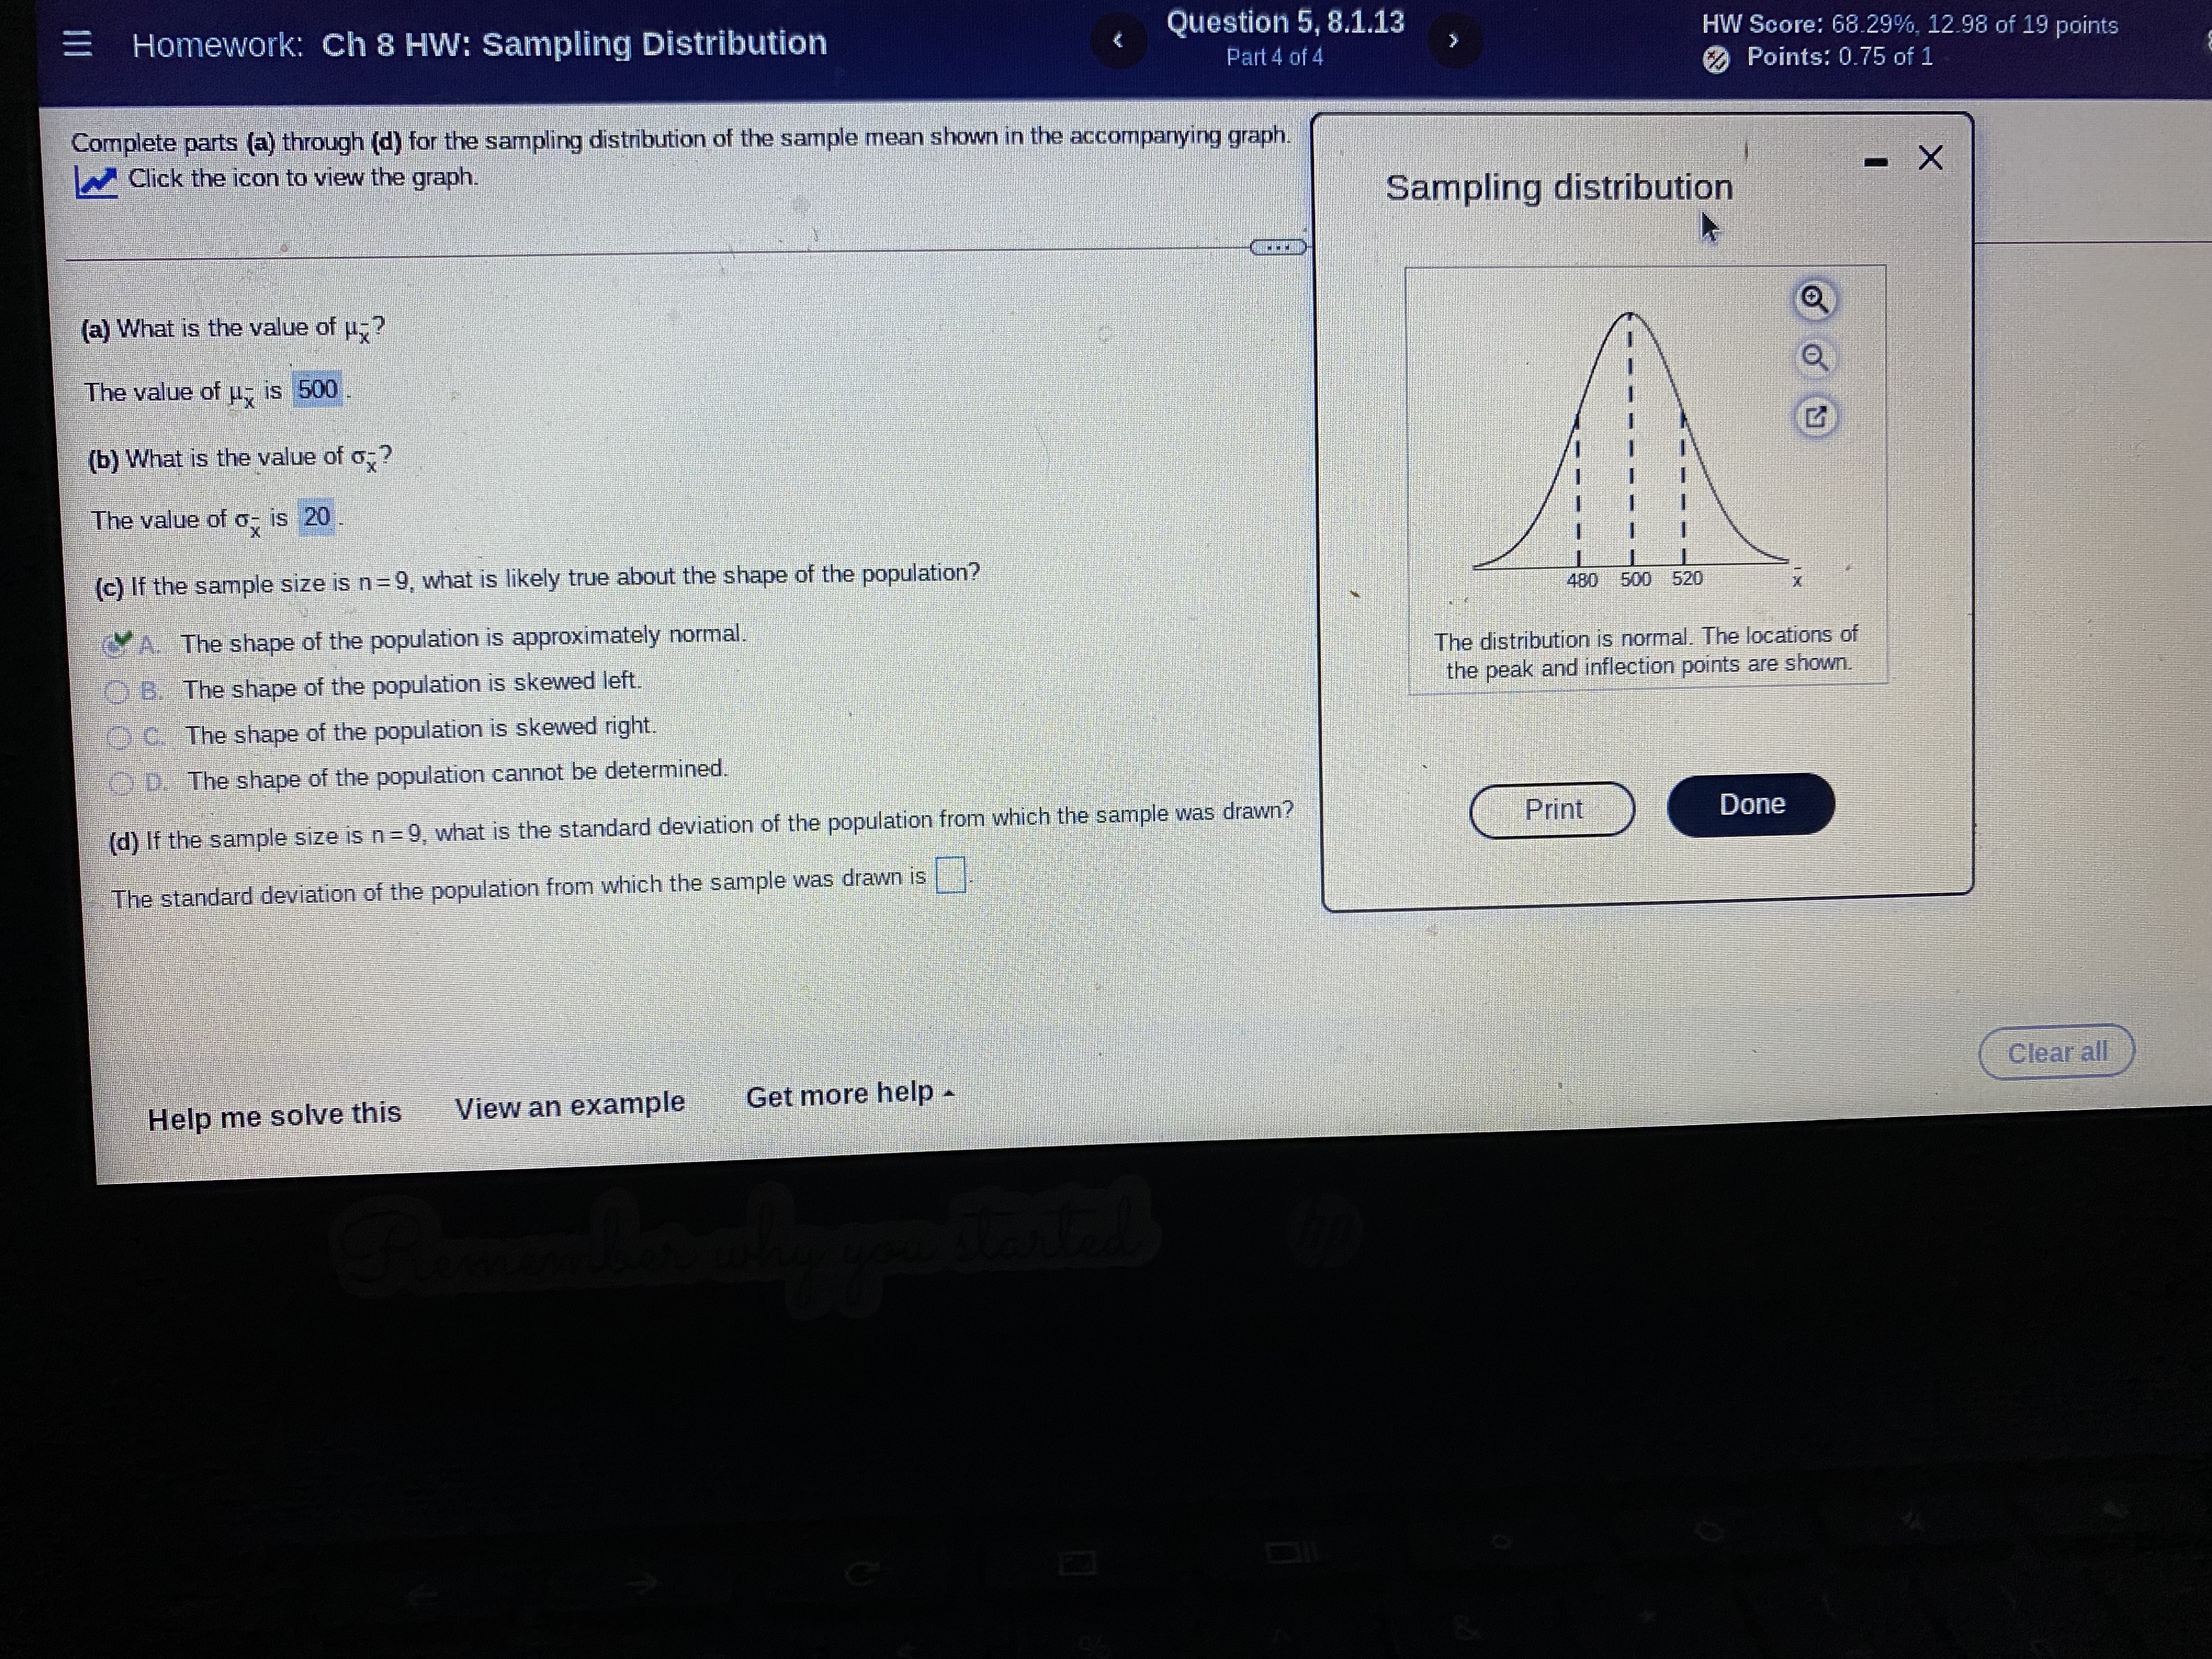
Homework: Ch 8 HW: Sampling Distribution Question 5, 8.1.13 HW Score: 68.29%, 12.98 of 19 points Part 4 of 4 Points: 0.75 of 1 Complete parts (a) through (d) for the sampling distribution of the sample mean shown in the accompanying graph. Click the icon to view the graph. - X Sampling distribution (a) What is the value of ux? The value of u is 500 (b) What is the value of ox ? The value of o- is 20 . (c) If the sample size is n=9, what is likely true about the shape of the population? 480 500 520 The shape of the population is approximately normal. The distribution is normal. The locations of B. The shape of the population is skewed left. the peak and inflection points are shown. C. The shape of the population is skewed right. The shape of the population cannot be determined (d) If the sample size is n= 9, what is the standard deviation of the population from which the sample was drawn? Print Done The standard deviation of the population from which the sample was drawn is Clear all Help me solve this View an example Get more help
Step by Step Solution
There are 3 Steps involved in it

Get step-by-step solutions from verified subject matter experts