

Question: Homework: Chapter 8. Risk and Return Question 9, P8-18 (book/static) Part 1 of 3 HW Score: 0%, 0 of 20 points O Points: 0 of
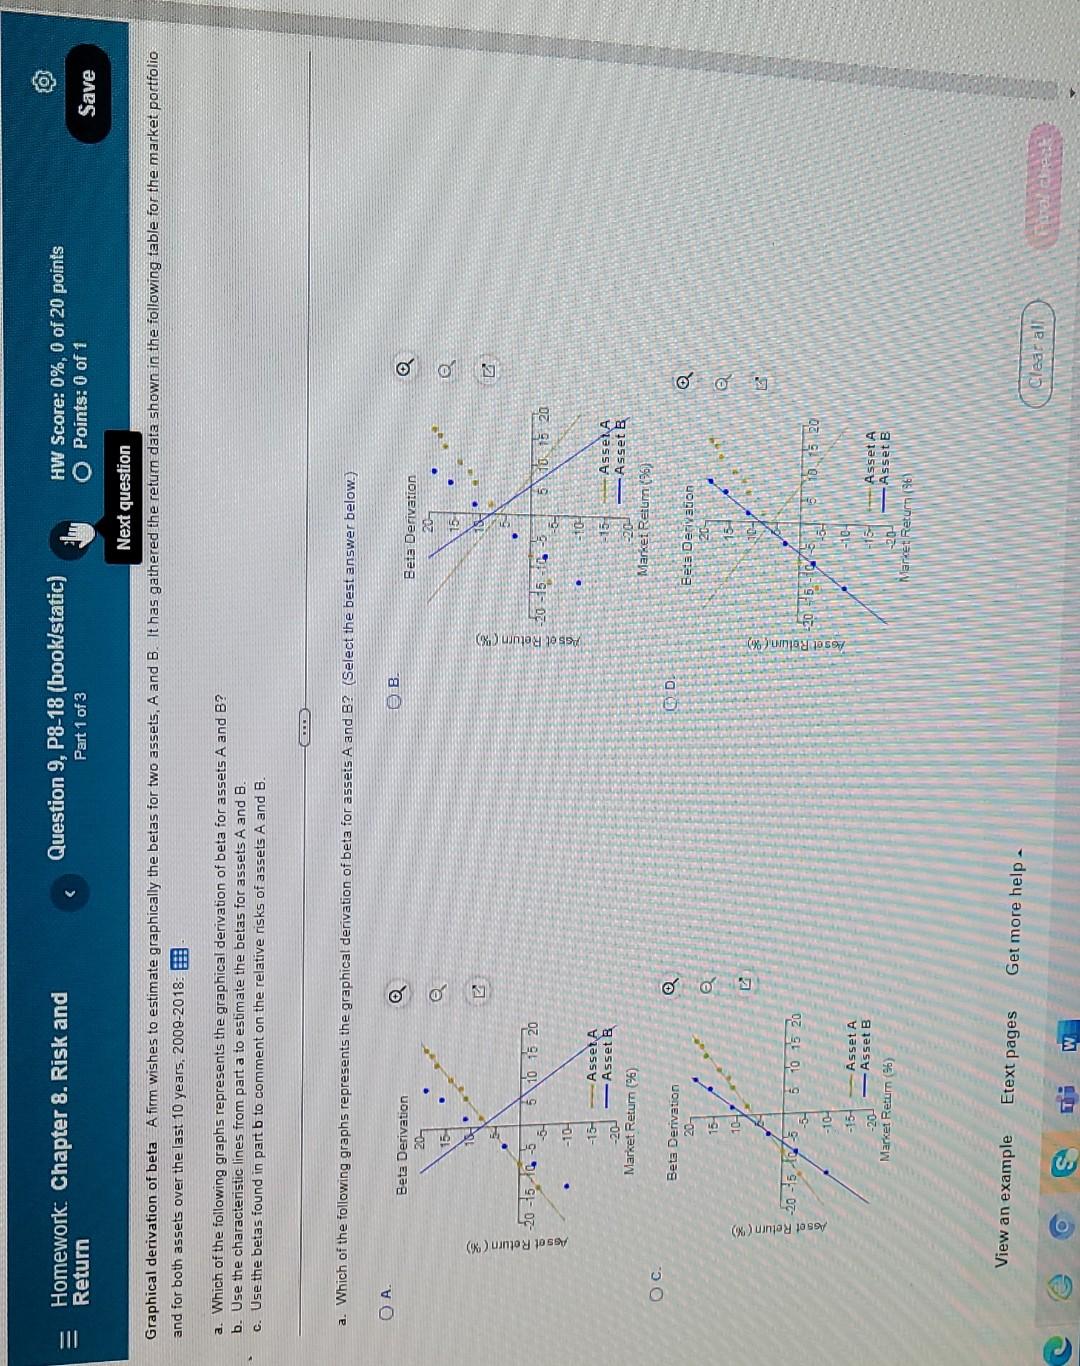
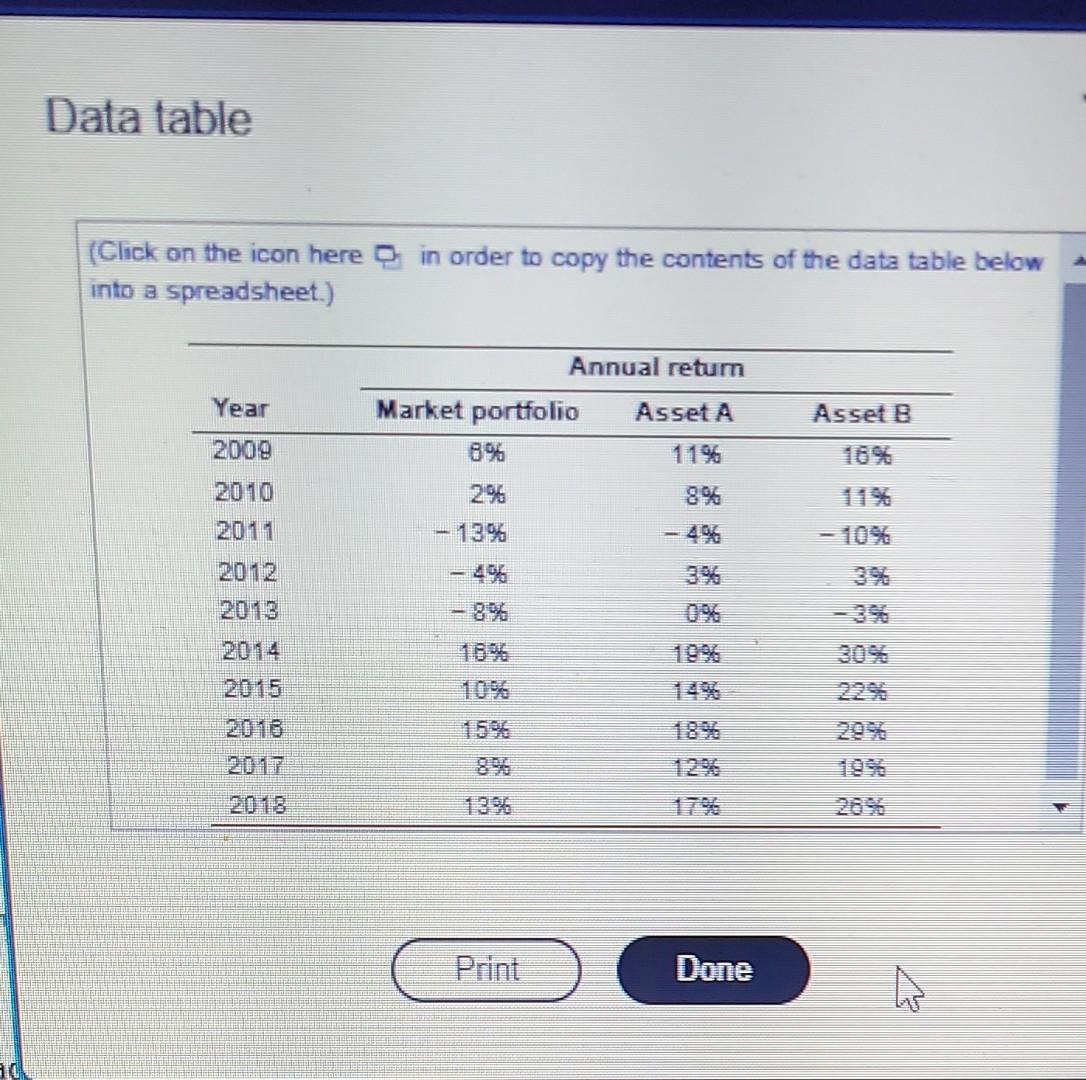
Homework: Chapter 8. Risk and Return Question 9, P8-18 (book/static) Part 1 of 3 HW Score: 0%, 0 of 20 points O Points: 0 of 1 Save Next question Graphical derivation of beta A firm wishes to estimate graphically the betas for two assets, A and B. It has gathered the return data shown in the following table for the market portfolio and for both assets over the last 10 years, 2009-2018: a. Which of the following graphs represents the graphical derivation of beta for assets A and B? b. Use the characteristic lines from part a to estimate the betas for assets A and B. c. Use the betas found in part b to comment on the relative risks of assets A and B. a. Which of the following graphs represents the graphical derivation of beta for assets A and B? (Select the best answer below.) OA B. Beta Derivation 20- o Beta Derivation o os 16 152 Asset Return () -20 -150-5 5 10 15 20 Get Return (%) -2035 5 10 15 20 -10- 10-1 -13- Asseta -20- Asset B Market Return (%) 15 - Assela Asset B Market Retum (96) Oc. Beta Derivation C D Beta Derivation Q @ 15 e 1047 Asset Return ("%) -20 =5075 6 10 15 20 loset Return(K) 415-10 10 15 20 -10 -10- -15- Asset A -200 -Asset B Market Return (95) Asset A Asset B Market Return (96) View an example Etext pages Get more help c Clear all 1 W. Data table (Click on the icon here in order to copy the contents of the data table below into a spreadsheet.) Year Annual return Market portfolio Asset A 6% 11% Asset B 2009 2010 8% 2% 13% 1192 - 1056 2011 - 4% - 46 2012 2013 2014 2015 Done Homework: Chapter 8. Risk and Return Question 9, P8-18 (book/static) Part 1 of 3 HW Score: 0%, 0 of 20 points O Points: 0 of 1 Save Next question Graphical derivation of beta A firm wishes to estimate graphically the betas for two assets, A and B. It has gathered the return data shown in the following table for the market portfolio and for both assets over the last 10 years, 2009-2018: a. Which of the following graphs represents the graphical derivation of beta for assets A and B? b. Use the characteristic lines from part a to estimate the betas for assets A and B. c. Use the betas found in part b to comment on the relative risks of assets A and B. a. Which of the following graphs represents the graphical derivation of beta for assets A and B? (Select the best answer below.) OA B. Beta Derivation 20- o Beta Derivation o os 16 152 Asset Return () -20 -150-5 5 10 15 20 Get Return (%) -2035 5 10 15 20 -10- 10-1 -13- Asseta -20- Asset B Market Return (%) 15 - Assela Asset B Market Retum (96) Oc. Beta Derivation C D Beta Derivation Q @ 15 e 1047 Asset Return ("%) -20 =5075 6 10 15 20 loset Return(K) 415-10 10 15 20 -10 -10- -15- Asset A -200 -Asset B Market Return (95) Asset A Asset B Market Return (96) View an example Etext pages Get more help c Clear all 1 W. Data table (Click on the icon here in order to copy the contents of the data table below into a spreadsheet.) Year Annual return Market portfolio Asset A 6% 11% Asset B 2009 2010 8% 2% 13% 1192 - 1056 2011 - 4% - 46 2012 2013 2014 2015 Done
Step by Step Solution
There are 3 Steps involved in it

Get step-by-step solutions from verified subject matter experts