

Question: Homework help show older details with the table in here . Please Correlation & Regression Homework Assignment PLOT the regression line in your scatterplot. Make
Homework help show older details with the table in here . Please
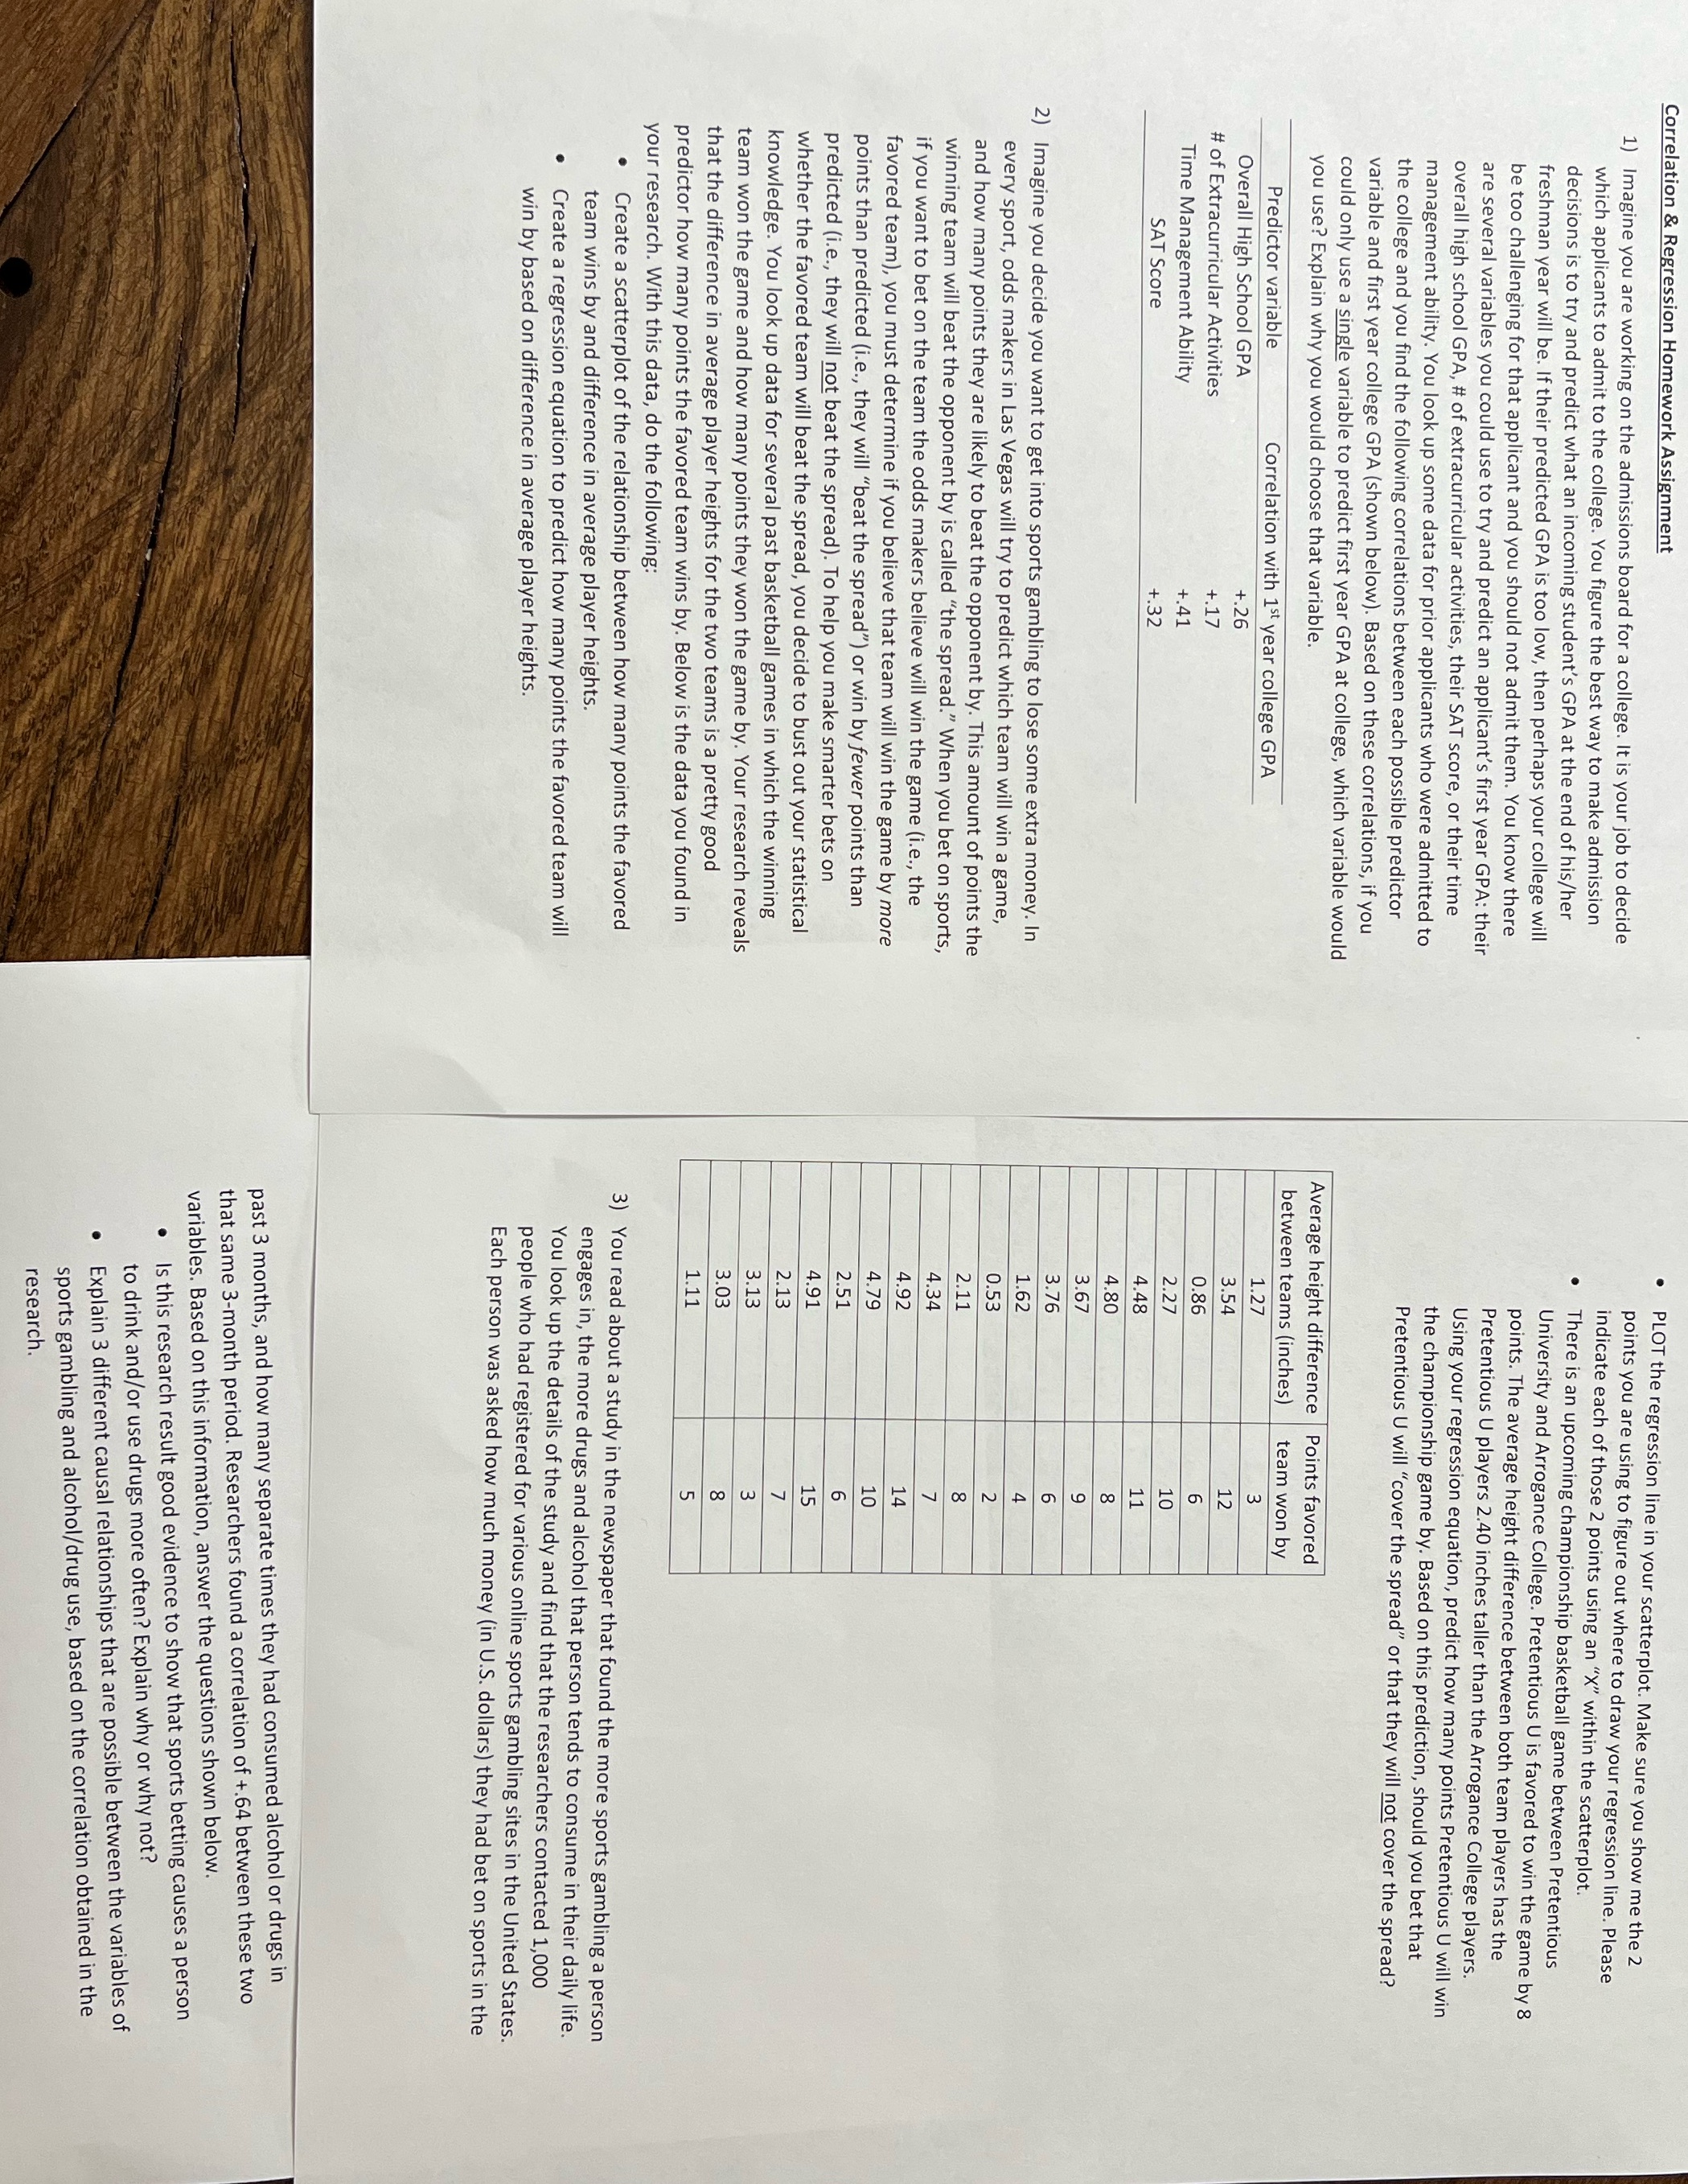
Correlation & Regression Homework Assignment PLOT the regression line in your scatterplot. Make sure you show me the 2 1) Imagine you are working on the admissions board for a college. It is your job to decide points you are using to figure out where to draw your regression line. Please which applicants to admit to the college. You figure the best way to make admission indicate each of those 2 points using an "X" within the scatterplot. decisions is to try and predict what an incoming student's GPA at the end of his/her There is an upcoming championship basketball game between Pretentious freshman year will be. If their predicted GPA is too low, then perhaps your college will University and Arrogance College. Pretentious U is favored to win the game by 8 be too challenging for that applicant and you should not admit them. You know there points. The average height difference between both team players has the are several variables you could use to try and predict an applicant's first year GPA: their Pretentious U players 2.40 inches taller than the Arrogance College players. overall high school GPA, # of extracurricular activities, their SAT score, or their time Using your regression equation, predict how many points Pretentious U will win management ability. You look up some data for prior applicants who were admitted to the championship game by. Based on this prediction, should you bet that the college and you find the following correlations between each possible predictor Pretentious U will "cover the spread" or that they will not cover the spread? variable and first year college GPA (shown below). Based on these correlations, if you could only use a single variable to predict first year GPA at college, which variable would you use? Explain why you would choose that variable. Average height difference Points favored between teams (inches) team won by Predictor variable Correlation with 1st year college GPA 1.27 Overall High School GPA +.26 3.54 # of Extracurricular Activities +.17 0.86 Time Management Ability +.41 2.27 SAT Score +.32 4.48 4.80 3.67 3.76 2) Imagine you decide you want to get into sports gambling to lose some extra money. In 1.62 every sport, odds makers in Las Vegas will try to predict which team will win a game, 0.53 and how many points they are likely to beat the opponent by. This amount of points the 2.11 winning team will beat the opponent by is called "the spread." When you bet on sports, 4.34 if you want to bet on the team the odds makers believe will win the game (i.e., the 4.92 favored team), you must determine if you believe that team will win the game by more points than predicted (i.e., they will "beat the spread") or win by fewer points than 4.79 2.51 predicted (i.e., they will not beat the spread). To help you make smarter bets on whether the favored team will beat the spread, you decide to bust out your statistical 4.91 2 .13 knowledge. You look up data for several past basketball games in which the winning 3.13 team won the game and how many points they won the game by. Your research reveals 3.03 that the difference in average player heights for the two teams is a pretty good predictor how many points the favored team wins by. Below is the data you found in 1.11 your research. With this data, do the following: . Create a scatterplot of the relationship between how many points the favored 3) You read about a study in the newspaper that found the more sports gambling a person team wins by and difference in average player heights. engages in, the more drugs and alcohol that person tends to consume in their daily life. Create a regression equation to predict how many points the favored team will You look up the details of the study and find that the researchers contacted 1,000 win by based on difference in average player heights. people who had registered for various online sports gambling sites in the United States. Each person was asked how much money (in U.S. dollars) they had bet on sports in the past 3 months, and how many separate times they had consumed alcohol or drugs in that same 3-month period. Researchers found a correlation of +.64 between these two variables. Based on this information, answer the questions shown below. . Is this research result good evidence to show that sports betting causes a person to drink and/or use drugs more often? Explain why or why not? Explain 3 different causal relationships that are possible between the variables of sports gambling and alcohol/drug use, based on the correlation obtained in the research
Step by Step Solution
There are 3 Steps involved in it

Get step-by-step solutions from verified subject matter experts