

Question: Homework: Problem Set 2 (Chapter 2) Score: 0 of 3 pts Appendix Problem 2 Consider the following data that show the quantity of coffee

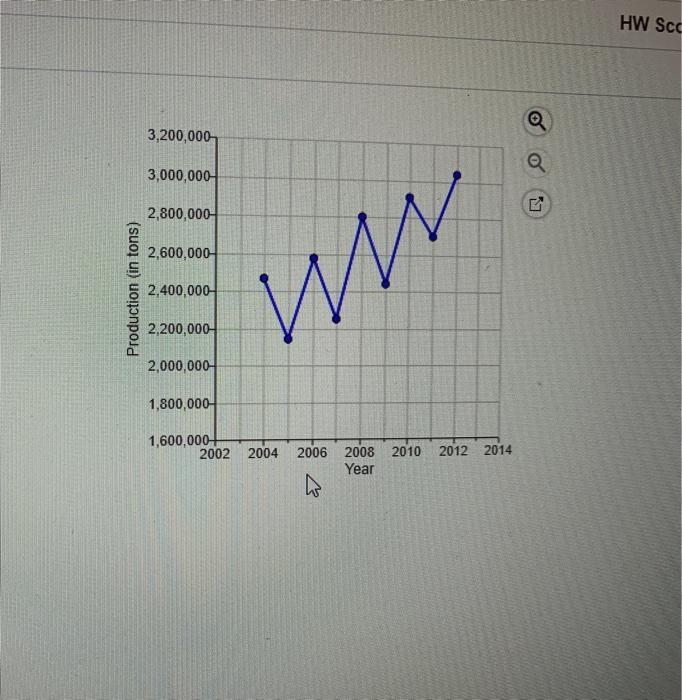
Homework: Problem Set 2 (Chapter 2) Score: 0 of 3 pts Appendix Problem 2 Consider the following data that show the quantity of coffee produced in Brazil from 2004 to 2012. Year Production (in tons) 2004 2,465,710 2005 2,140,169 2,573,368 2,249,011 2,796,927 2006 2007 2008 2009 2010 2011 2012 2,440,056 2,907,265 2,700,440 3,037,534 This is illustrated in the time series graph on the right. The mean quantity of coffee that Brazil produced from 2009 to 2011 is tons (Round your response to two decimal places.) Production (in tons) 3,200,000 3,000,000 2,800,000 2,600,000 2,400,000 ww. V 2,200,000 2,000,000 1,800,000 1,600,000+ 2002 2004 2006 2008 2010 2012 Year Q 2014 57 HW Scc
Step by Step Solution
3.37 Rating (153 Votes )
There are 3 Steps involved in it
ANSWER Mean coffee produced in 2009 coffee produce... View full answer

Get step-by-step solutions from verified subject matter experts