

Question: Homework Problems 1. Problem 7.2 on page 231. Here's the data file & you should read in. I like the authors' challenge... I hope you
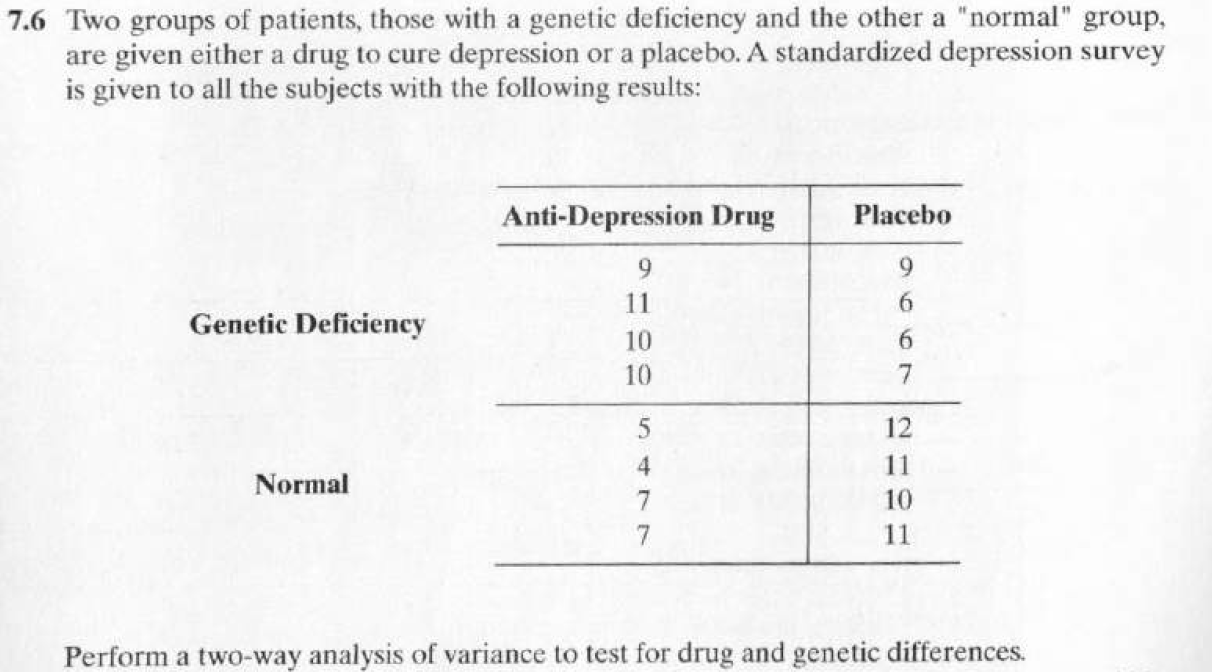
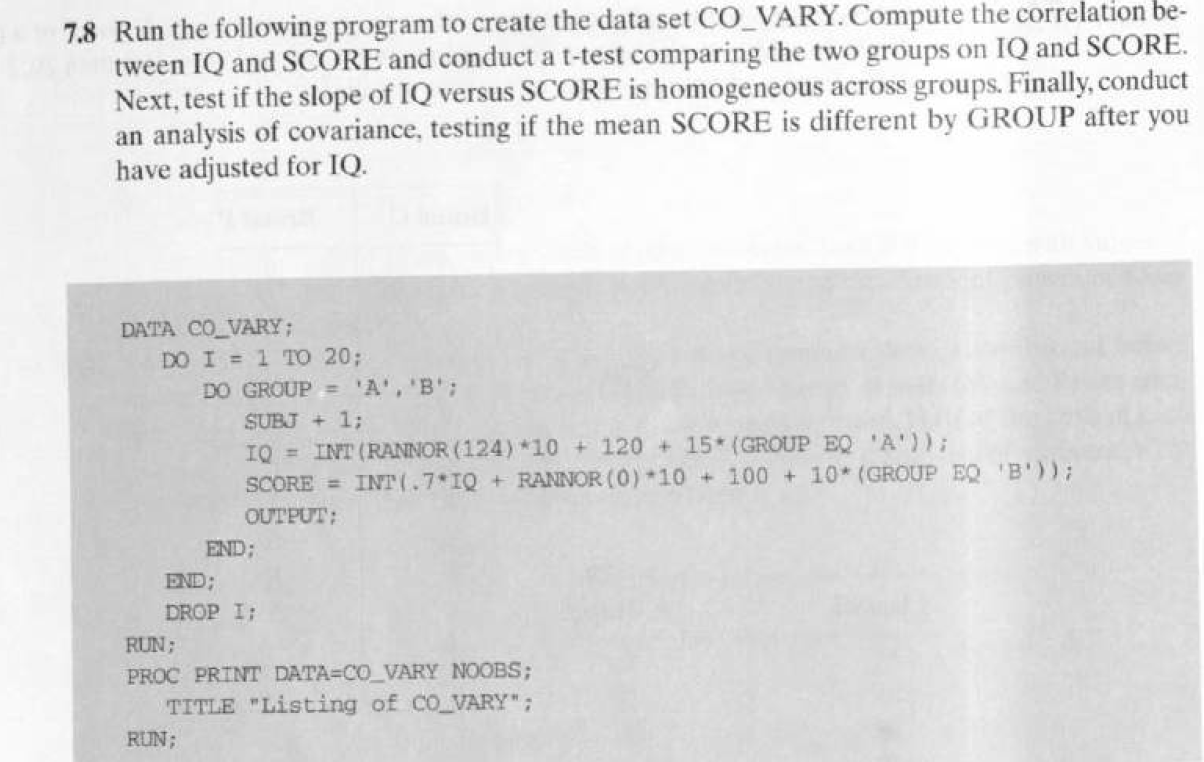
Homework Problems 1. Problem 7.2 on page 231. Here's the data file & you should read in. I like the authors' challenge... I hope you will, too. (I did use an array in my solution.) 2. Problem 7.6 on page 233. Use nested do loops to generate the experimental design and to input the scores into a SAS data set called depression. Then, use GLM to perform the two-way analysis. After determining that there is a significant interaction between group and trt, use the MEANS and GPLOT procedures to create an interaction plot. 3. Problem 7.8 on page 234. Here's the program & you'll need to run in order to create the co_vary data set.7.6 Two groups of patients. those with a genetic deficiency and the other a "normal\" group, are given either a drug to cure depression or a placebo. A standardized depression survey is given to all the subjects with the following results: Anti-Depression Drug Genetic Deciency Normal Perform a twoway analysis of variance to test for drug and genetic differences 7.8 Run the following program to create the data set CO_VARY. Compute the correlation be- tween IQ and SCORE and conduct a t-test comparing the two groups on IQ and SCORE. Next, test if the slope of IQ versus SCORE is homogeneous across groups. Finally, conduct an analysis of covariance, testing if the mean SCORE is different by GROUP after you have adjusted for IQ. DATA CO_VARY ; DO I = 1 TO 20; DO GROUP = 'A' , 'B'; SUBJ + 1; IQ = INT (RANNOR (124) *10 + 120 + 15*(GROUP EQ 'A') ) ; SCORE = INT(. 7* IQ + RANNOR (0) -10 + 100 + 10* (GROUP EQ 'B') ) ; OUTPUT; END; END; DROP I; RUN; PROC PRINT DATA=CO_VARY NOOBS; TITLE "Listing of CO_VARY"; RUN
Step by Step Solution
There are 3 Steps involved in it

Get step-by-step solutions from verified subject matter experts