

Question: Homework: Quantitative Demand Analysis Assi... Saved Help Save & Exit S Check my w 5 Suppose the Kalamazoo Brewing Company (KBC) currently sells its microbrews
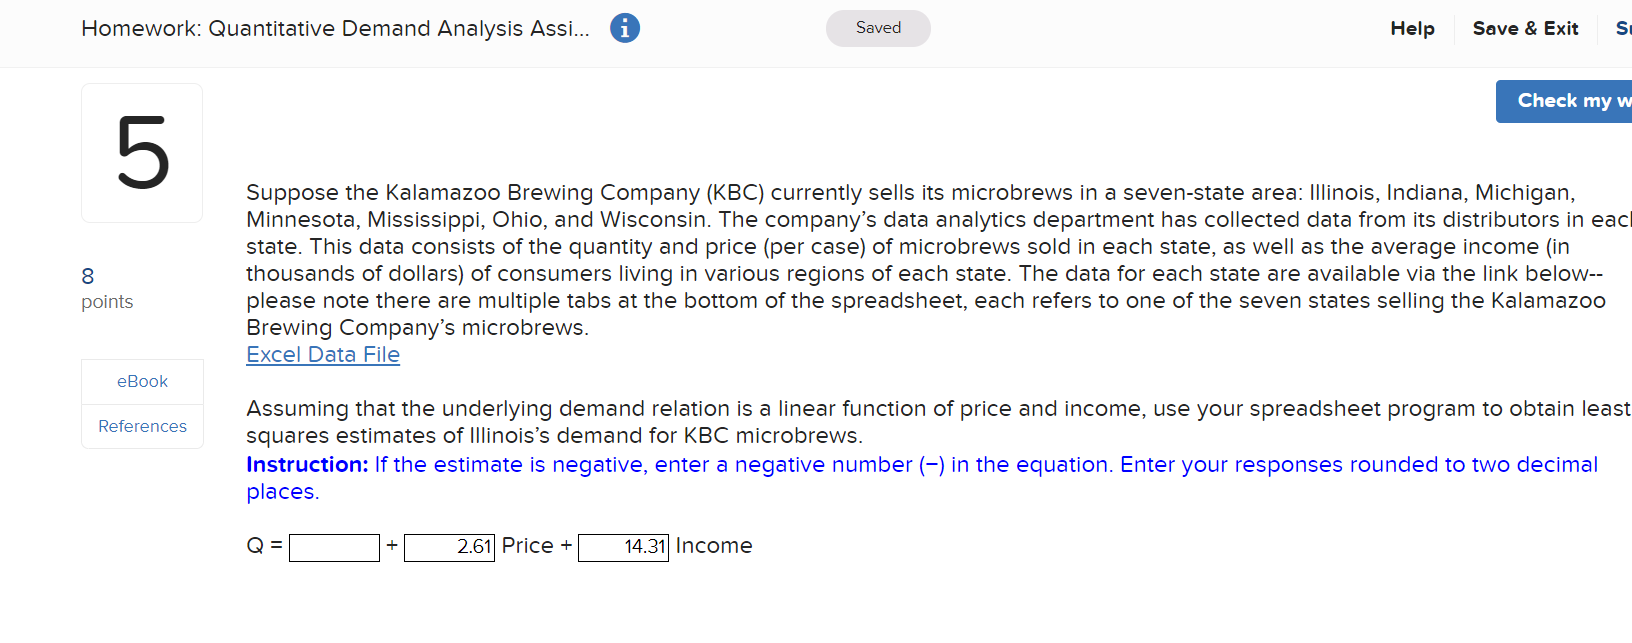
Homework: Quantitative Demand Analysis Assi... Saved Help Save & Exit S Check my w 5 Suppose the Kalamazoo Brewing Company (KBC) currently sells its microbrews in a seven-state area: Illinois, Indiana, Michigan, Minnesota, Mississippi, Ohio, and Wisconsin. The company's data analytics department has collected data from its distributors in ead state. This data consists of the quantity and price (per case) of microbrews sold in each state, as well as the average income (in 8 thousands of dollars) of consumers living in various regions of each state. The data for each state are available via the link below-- points please note there are multiple tabs at the bottom of the spreadsheet, each refers to one of the seven states selling the Kalamazoo Brewing Company's microbrews. Excel Data File eBook Assuming that the underlying demand relation is a linear function of price and income, use your spreadsheet program to obtain least References squares estimates of Illinois's demand for KBC microbrews. Instruction: If the estimate is negative, enter a negative number (-) in the equation. Enter your responses rounded to two decimal places. Q = 2.61 Price + 14.31 Income
Step by Step Solution
There are 3 Steps involved in it

Get step-by-step solutions from verified subject matter experts