

Question: homework question Complete Questions (a and b) from Case 3.1 on page 148 of the textbook For Question (a) you will prepare a Common-Size Income
homework question
Complete Questions (a and b) from Case 3.1 on page 148 of the textbook
For Question (a) you will prepare a Common-Size Income Statement based on Intels 2013 and 2014 Form 10-K and annual reports (located in the Financial Documents of the Resources tab). You will continue to use the Financial Analysis file from Assignment 2.2. You will complete the data for Fiscal Years 2010, 2011, 2012, and 2013 as noted by the template. Reference Exhibit 3.3 on page 107 of your textbook.
Feedback: Please correct to recieve credit
Income Statement:
Need to look at the Gross Profit for 2011 & 2010 need to have a value.
Please explain how you arrived at the totals for Op Income for 2011 & 2010 Line 11?
need help with my income statement sheet-
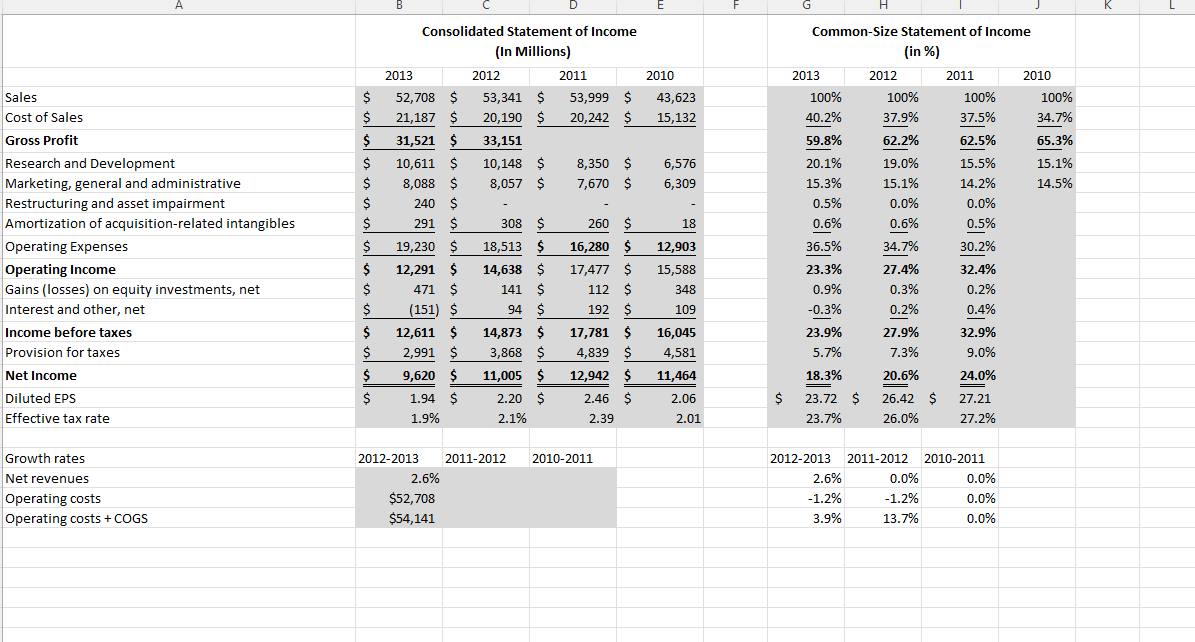
A B D E 2010 $ $ $ 43,623 15,132 $ 6,576 6,309 $ $ $ $ $ Consolidated Statement of Income (in Millions) 2013 2012 2011 52,708 $ 53,341 $ 53,999 $ 21,187 $ 20,190 $ 20,242 $ 31,521 $ 33,151 10,611 $ 10,148 $ 8,350 $ 8,088 $ 8,057 $ 7,670 $ 240 $ 291 $ 308 $ 260 $ 19,230 $ 18,513 $ 16,280 $ 12,291 $ 14,638 $ 17,477 $ 471 $ 141 $ 112 $ (151) $ 94 $ 192 $ 12,611 $ 14,873 $ 17,781 $ 2,991 $ 3,868 $ 4,839 $ 9,620 $ 11,005 $ 12,942 $ 1.94 $ 2.20 $ 2.46 $ 1.9% 2.1% 2.39 18 Sales Cost of Sales Gross Profit Research and Development Marketing, general and administrative Restructuring and asset impairment Amortization of acquisition-related intangibles Operating Expenses Operating Income Gains (losses) on equity investments, net Interest and other, net , Income before taxes Provision for taxes Net Income Diluted EPS Effective tax rate Common-Size Statement of Income (in %) 2013 2012 2011 2010 100% 100% 100% 100% 40.2% 37.9% 37.5% 34.7% 59.8% 62.2% 62.5% 65.3% 20.1% 19.0% 15.5% 15.1% 15.3% 15.1% 14.2% 14.5% 0.5% 0.0% 0.0% 0.6% 0.6% 0.5% 36.5% 34.7% 30.2% 23.3% 27.4% 32.4% 0.9% 0.3% 0.2% -0.3% 0.2% 0.4% 23.9% 27.9% 32.9% 5.7% 7.3% 9.0% 18.3% 20.6% 24.0% 23.72 $ 26.42 $ 27.21 23.7% 26.0% 27.2% $ 12,903 15,588 348 $ $ $ $ $ $ $ 109 16,045 4,581 11,464 $ 2.06 2.01 2010-2011 Growth rates Net revenues Operating costs Operating costs +COGS 2012-2013 2011-2012 2.6% $52,708 $54,141 2012-2013 2.6% -1.2% 3.9% 2011-2012 2010-2011 0.0% 0.0% -1.2% 0.0% 13.7% 0.0%
Step by Step Solution
There are 3 Steps involved in it

Get step-by-step solutions from verified subject matter experts