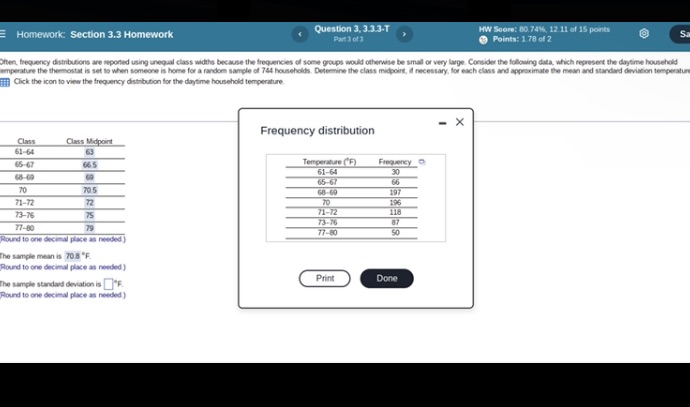
Question: Homework Section 3.3 Homework Question 3. 3.3.3-T HW Score: 80 741, 12 11 of 15 points Part 3 of 1 Points: 1 78 of 2

Homework Section 3.3 Homework Question 3. 3.3.3-T
Homework Section 3.3 Homework Question 3. 3.3.3-T HW Score: 80 741, 12 11 of 15 points Part 3 of 1 Points: 1 78 of 2 Often, frequency distributions are reported using unequal class widths became the frequencies of some groups would otherwise be small or very Large. Comider the following data, which represent the daytime household empenature the thermostat is set to when someone in home for a random sample of 744 households. Determine the class midpoint. if necessary for each class and approximate the mein and standard deviation temperature fffClick the icon to view the frequency distribution for the daytime household temperature. = X Frequency distribution Class Class Midpoint 61-64 60 5 Temperature ("F) Frequency 61-64 65-67 65 70 70 5 71-72 72 73-76 75 71-12 118 79 73 76 77-80 77-80 50 Round to one decimal place an needed The sample mean is 70.8 "F Round to one decimal place an needed ] The sample standard deviation is "F Print Done Found to one decimal place as needed ]

Step by Step Solution

There are 3 Steps involved in it

1 Expert Approved Answer
Step: 1 Unlock blur-text-image
Question Has Been Solved by an Expert!

Get step-by-step solutions from verified subject matter experts

Step: 2 Unlock
Step: 3 Unlock

Students Have Also Explored These Related Mathematics Questions!