

Question: Homeworks: Interpolation with DataFrame Download the given csv file (do not change the format, keep at csv) . Read the file . Get the data
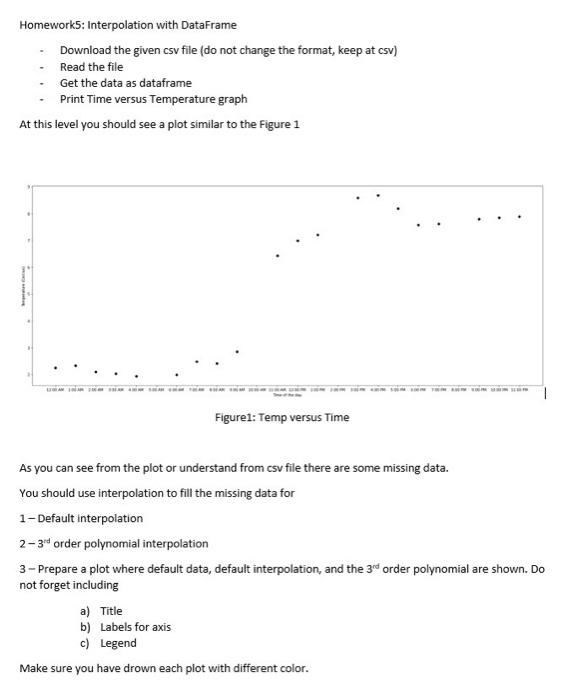
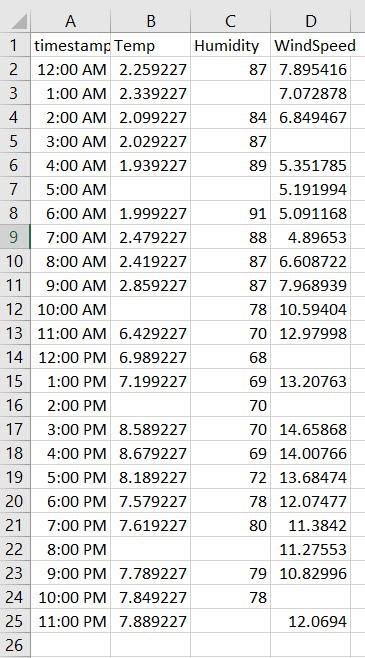
Homeworks: Interpolation with DataFrame Download the given csv file (do not change the format, keep at csv) . Read the file . Get the data as dataframe Print Time versus Temperature graph At this level you should see a plot similar to the Figure 1 Figurel: Temp versus Time As you can see from the plot or understand from csv file there are some missing data. You should use interpolation to fill the missing data for 1- Default interpolation 2-34 order polynomial interpolation 3 - Prepare a plot where default data, default interpolation, and the 3rf order polynomial are shown. Do not forget including a) Title b) Labels for axis c) Legend Make sure you have drown each plot with different color. A . D 1 timestamp Temp Humidity WindSpeed 2 12:00 AM 2.259227 87 7.895416 3 1:00 AM 2.339227 7.072878 4 2:00 AM 2.099227 84 6.849467 5 3:00 AM 2.029227 87 6 4:00 AM 1.939227 89 5.351785 7 5:00 AM 5.191994 8 6:00 AM 1.999227 91 5.091168 9 7:00 AM 2.479227 88 4.89653 10 8:00 AM 2.419227 87 6.608722 11 9:00 AM 2.859227 87 7.968939 12 10:00 AM 78 10.59404 13 11:00 AM 6.429227 70 12.97998 14 12:00 PM 6.989227 68 15 1:00 PM 7.199227 69 13.20763 16 2:00 PM 70 17 3:00 PM 8.589227 70 14.65868 18 4:00 PM 8.679227 69 14.00766 19 5:00 PM 8.189227 72 13.68474 20 6:00 PM 7.579227 78 12.07477 21 7:00 PM 7.619227 80 11.3842 22 8:00 PM 11.27553 23 9:00 PM 7.789227 79 10.82996 24 10:00 PM 7.849227 78 25 11:00 PM 7.889227 12.0694 26
Step by Step Solution
There are 3 Steps involved in it

Get step-by-step solutions from verified subject matter experts