

Question: Horizontal Analysis Completing this activity will help you learn to: - Evaluate a company's performance using horizontal analysis. - Extract information from a data set
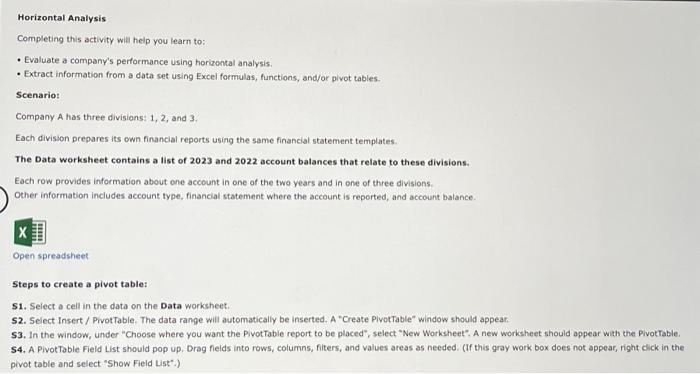
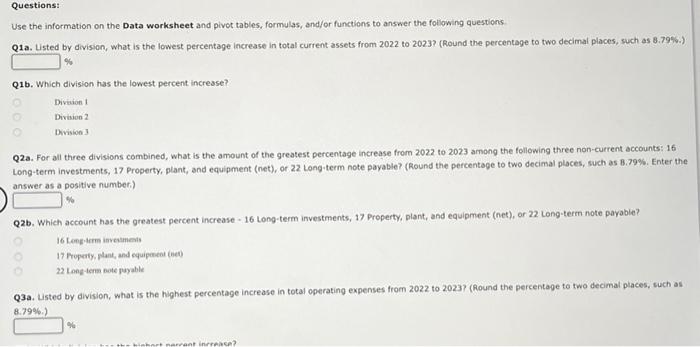
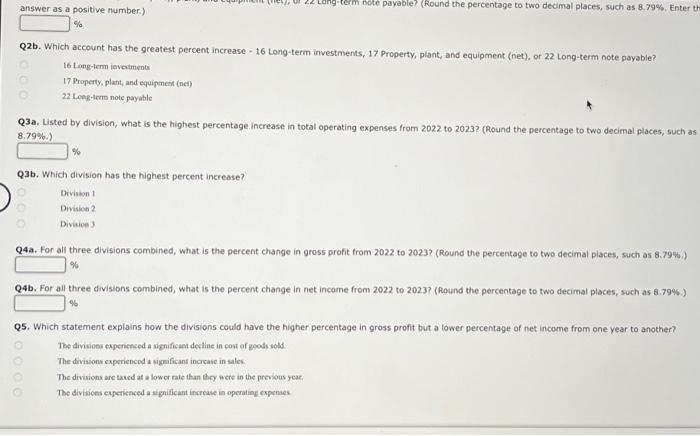
Horizontal Analysis Completing this activity will help you learn to: - Evaluate a company's performance using horizontal analysis. - Extract information from a data set using Excel formulas, functions, and/or pivot tables. Scenario: Company A has three divisions: 1,2 , and 3. Each division prepares its own financial reports using the same financial statement templates. The Data worksheet contains a list of 2023 and 2022 account balances that relate to these divisions. Each row provides information about one account in one of the two years and in one of three divisions. Other information includes account type, financial statement where the account is reported, and account balance. Open spreadsheet Steps to create a pivot table: 51. Select a cell in the data on the Data worksheet. 52. Select Insert / PivotTable. The data range will automatically be inserted. A "Create PivotTable" window should appear. 53. In the window, under "Choose where you want the PivotTable report to be placed", select "New Worksheet". A new worksheet should appear with the PivotTable. S4. A Pivot Table Field List should pop up. Drag fields into rows, columns, fiters, and values areas as needed. (If this gray work box does not appear, right click in the pivot table and select "Show Field List".) Use the information on the Data worksheet and pivot tables, formulas, and/or functions to answer the following questions Q1a. Listed by division, what is the lowest percentage increase in total current assets from 2022 to 2023 ? (Round the percentage to two decimal places, such as 8.7996. ) Q1b. Which division has the lowest percent increase? Division 1 Division 2 Dvision 3 Q2a. For all three divisions combined, what is the amount of the greatest percentage increase from 2022 to 2023 among the following three non-current accounts: 16 Long-term investments, 17 Property, plant, and equipment (net), or 22 Long-term note payable? (Round the percentoge to two decimal places, such as 8.79%. Enter the answer as a positive number.) Q2b. Which account has the greatest percent increase - 16 Long-term investments, 17 Property, plant, and equipment (net), or 22 Long-term note payabie? 16 Lembtem invesimeats 17 Froperty, plant, and equipeneat (nev) 22 Long-ters bote puyble Q3a. Usted by avision, what is the highest percentage increase in total operating expenses from 2022 to 2023 ? (Round the percentage to two decimal places, such as 8.79\%.) answer as a positive number.) % Q2b. Which account has the greatest percent increase - 16 Long-term investments, 17 Property, plant, and equipment (net), or 22 Long-term note payable? 16 Lopg-term ievectments 17 Property, plant, and equipment (nes) 22 Long-irm note payable Q3a. Listed by division, what is the highest percentage increase in total operating expenses from 2022 to 2023 ? (Round the percentage to two decimal places, such as 8.79% ) Q3b. Which division has the highest percent increase? Divison 1 Division 2 Division 3 Q4a. For all three divisions combined, what is the percent change in gross profit from 2022 to 2023 ? (Round the percentage to two decimal places, such as 8.79% ) % Q4b. For all three divisions combined, what is the percent change in net income from 2022 to 2023 ? (Round the percentage to two decimal places, such as 8.79%.) Q5. Which statement explains how the divisions could have the higher percentage in gross profit but a lower percentage of net income from one year to another? The divisiosi experienced a significant decline in cost of goods sold. The divisions experienced a significant increase in sales: The divisions are taud at a lowcr rate than thry were in the provious year. The divisions experienced a significant increase in operating expenaes. Horizontal Analysis Completing this activity will help you learn to: - Evaluate a company's performance using horizontal analysis. - Extract information from a data set using Excel formulas, functions, and/or pivot tables. Scenario: Company A has three divisions: 1,2 , and 3. Each division prepares its own financial reports using the same financial statement templates. The Data worksheet contains a list of 2023 and 2022 account balances that relate to these divisions. Each row provides information about one account in one of the two years and in one of three divisions. Other information includes account type, financial statement where the account is reported, and account balance. Open spreadsheet Steps to create a pivot table: 51. Select a cell in the data on the Data worksheet. 52. Select Insert / PivotTable. The data range will automatically be inserted. A "Create PivotTable" window should appear. 53. In the window, under "Choose where you want the PivotTable report to be placed", select "New Worksheet". A new worksheet should appear with the PivotTable. S4. A Pivot Table Field List should pop up. Drag fields into rows, columns, fiters, and values areas as needed. (If this gray work box does not appear, right click in the pivot table and select "Show Field List".) Use the information on the Data worksheet and pivot tables, formulas, and/or functions to answer the following questions Q1a. Listed by division, what is the lowest percentage increase in total current assets from 2022 to 2023 ? (Round the percentage to two decimal places, such as 8.7996. ) Q1b. Which division has the lowest percent increase? Division 1 Division 2 Dvision 3 Q2a. For all three divisions combined, what is the amount of the greatest percentage increase from 2022 to 2023 among the following three non-current accounts: 16 Long-term investments, 17 Property, plant, and equipment (net), or 22 Long-term note payable? (Round the percentoge to two decimal places, such as 8.79%. Enter the answer as a positive number.) Q2b. Which account has the greatest percent increase - 16 Long-term investments, 17 Property, plant, and equipment (net), or 22 Long-term note payabie? 16 Lembtem invesimeats 17 Froperty, plant, and equipeneat (nev) 22 Long-ters bote puyble Q3a. Usted by avision, what is the highest percentage increase in total operating expenses from 2022 to 2023 ? (Round the percentage to two decimal places, such as 8.79\%.) answer as a positive number.) % Q2b. Which account has the greatest percent increase - 16 Long-term investments, 17 Property, plant, and equipment (net), or 22 Long-term note payable? 16 Lopg-term ievectments 17 Property, plant, and equipment (nes) 22 Long-irm note payable Q3a. Listed by division, what is the highest percentage increase in total operating expenses from 2022 to 2023 ? (Round the percentage to two decimal places, such as 8.79% ) Q3b. Which division has the highest percent increase? Divison 1 Division 2 Division 3 Q4a. For all three divisions combined, what is the percent change in gross profit from 2022 to 2023 ? (Round the percentage to two decimal places, such as 8.79% ) % Q4b. For all three divisions combined, what is the percent change in net income from 2022 to 2023 ? (Round the percentage to two decimal places, such as 8.79%.) Q5. Which statement explains how the divisions could have the higher percentage in gross profit but a lower percentage of net income from one year to another? The divisiosi experienced a significant decline in cost of goods sold. The divisions experienced a significant increase in sales: The divisions are taud at a lowcr rate than thry were in the provious year. The divisions experienced a significant increase in operating expenaes
Step by Step Solution
There are 3 Steps involved in it
To address these questions using Excel follow these steps for horizontal analysis Step 1 Create Pivot Tables 1 Open the Data Worksheet Make sure all r... View full answer

Get step-by-step solutions from verified subject matter experts