

Question: Horizontal Analysis. Each is to be Increase, Decrease, or Not possible to compute Comparative information taken from Friction Company's financial statements is shown below (a)
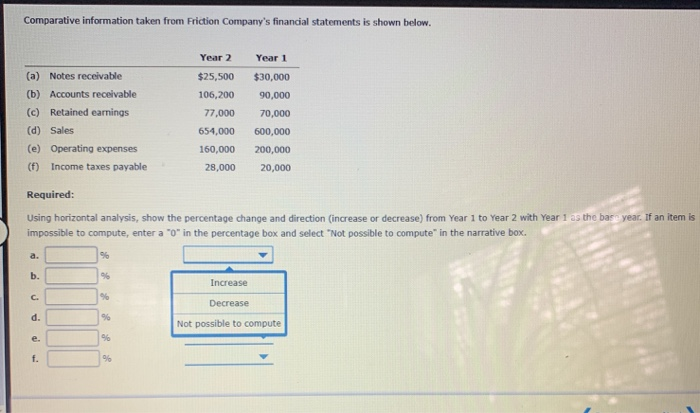
Comparative information taken from Friction Company's financial statements is shown below (a) Notes receivable (b) Accounts receivable (c) Retained earnings (d) Sales (e) Operating expenses (f) Income taxes payable Year 2 Year 1 $25,500 $30,000 106,200 90,000 77,000 70,000 654,000 600,000 160,000 200,000 28,000 20,000 Required: Using horizontal analysis, show the percentage change and direction (increase or decrease) from Year 1 to Year 2 with Year 1 as the ba impossible to compute, enter a "O" in the percentage box and select "Not possible to compute" in the narrative box. se year. If an item is a. b. Increase Decrease Not possible to compute C. e
Step by Step Solution
There are 3 Steps involved in it

Get step-by-step solutions from verified subject matter experts