

Question: Horizontal Analysis The comparative accounts payable and long-term debt balances for a company follow. Current Year Previous Year Accounts payable $114,240 $102,000 Long-term debt 127,200
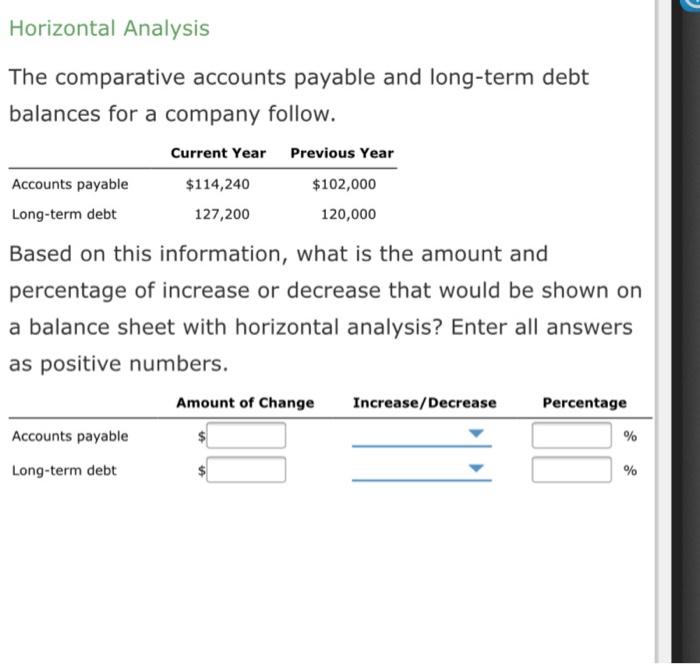
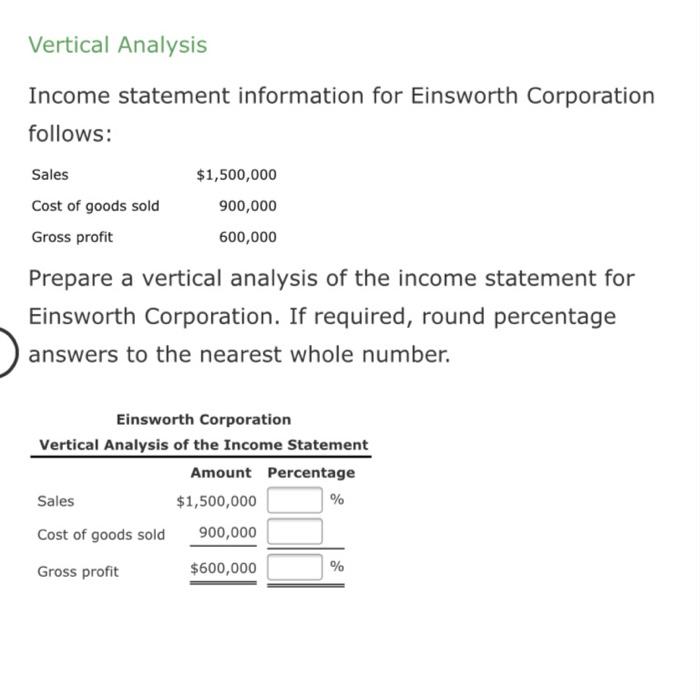
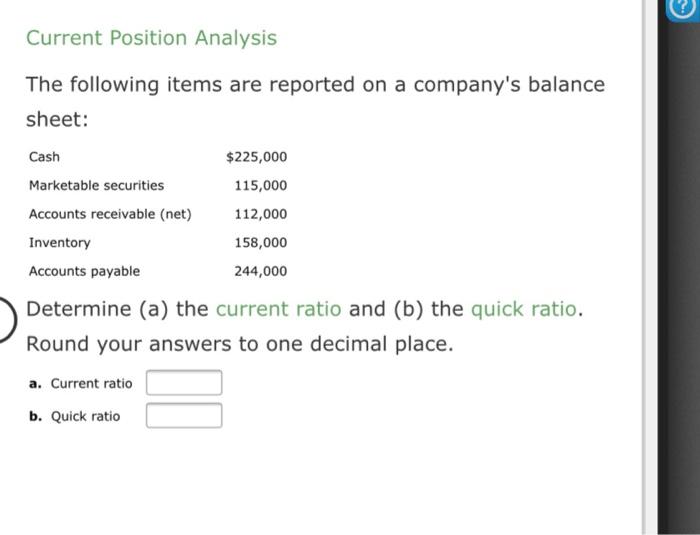
Horizontal Analysis The comparative accounts payable and long-term debt balances for a company follow. Current Year Previous Year Accounts payable $114,240 $102,000 Long-term debt 127,200 120,000 Based on this information, what is the amount and percentage of increase or decrease that would be shown on a balance sheet with horizontal analysis? Enter all answers as positive numbers. Amount of Change Increase/Decrease Percentage Accounts payable % Long-term debt % Vertical Analysis Income statement information for Einsworth Corporation follows: Sales Cost of goods sold Gross profit $1,500,000 900,000 600,000 Prepare a vertical analysis of the income statement for Einsworth Corporation. If required, round percentage answers to the nearest whole number. Einsworth Corporation Vertical Analysis of the Income Statement Amount Percentage Sales $1,500,000 % Cost of goods sold 900,000 Gross profit $600,000 % Current Position Analysis The following items are reported on a company's balance sheet: Cash Marketable securities Accounts receivable (net) Inventory Accounts payable $225,000 115,000 112,000 158,000 244,000 Determine (a) the current ratio and (b) the quick ratio. Round your answers to one decimal place. a. Current ratio b. Quick ratio
Step by Step Solution
There are 3 Steps involved in it

Get step-by-step solutions from verified subject matter experts